The Public Library Data Service 2012 Statistical Report: Characteristics and Trends
The Public Library Data Service (PLDS) is an annual survey conducted by PLA. This 2012 survey of public libraries from the United States and Canada collected fiscal year (FY) 2011 information on finances, library resources, annual use figures, and technology. Each year PLDS includes a special survey highlighting statistics on one service area or public library topic. This year these supplemental questions focused on young adult library services.
PLA has partnered with Counting Opinions (SQUIRE) Ltd., to provide the service for administering and supporting the survey. As well, PLA-launched PLAmetrics, an online subscription service offering access to the longitudinal PLDS data sets for this and subsequent survey years going back to 2002. The advent of PLAmetrics gives public libraries timely access to meaningful and relevant public library data for comparative analysis and the assessment of their operations by offering an array of pre-configured summary reports in online published formats and in ready-to run and/or customizable report templates. As well, PLAmetrics subscribers can create any number of custom reports based on the available data definitions and participating libraries from any one or more years of PLDS data, including data from the Institute of Museums and Library Services (IMLS).
The graphs, comments, and calculations used in this report were derived from data in PLAmetrics. This report presents a selection of metrics for PLDS which presents results for the most recent FY2011 and previous results in tables and charts with related observations.
Research Method and Context
The participation in the PLDS is voluntary and participants have the option of providing responses to all or some of the questions that comprise the survey. This year, similar to previous years, all public libraries in the United States and Canada were invited to participate in the survey. Emails (3,284) were sent to launch the survey in January 2012, postcards were handed out at the PLA 2012 Conference in Philadelphia last March, letters were sent to the libraries, and four follow-up emails were sent between the beginning of March and the end of April. State data coordinators from the U.S. and provincial and association coordinators in Canada were contacted and asked to promote the survey to their libraries. Their involvement led to increased awareness and participation. Of the libraries contacted, 1,829 responded to the request for data, a response rate of 19.7 percent (an increase of 2.4 percent from last year). However, due to the voluntary nature of this survey, there was a high dropout rate, and many libraries had to be contacted for additional data. Although only 1,579 libraries were included in the final data analysis, this number still represented an increase over 2011’s number of 1,461 and 1,105 for 2010.
Please refer to the online PLDS Survey site for copies of the survey and full wording of the questions included.
Overall Service Summary
The PLDS Survey includes several questions that effectively describe the characteristics of each of the responding libraries. In table 1, a selection of these descriptive statistics is presented and summary data is provided with respect to all libraries that provided values greater than zero (>0) for each selected measure.
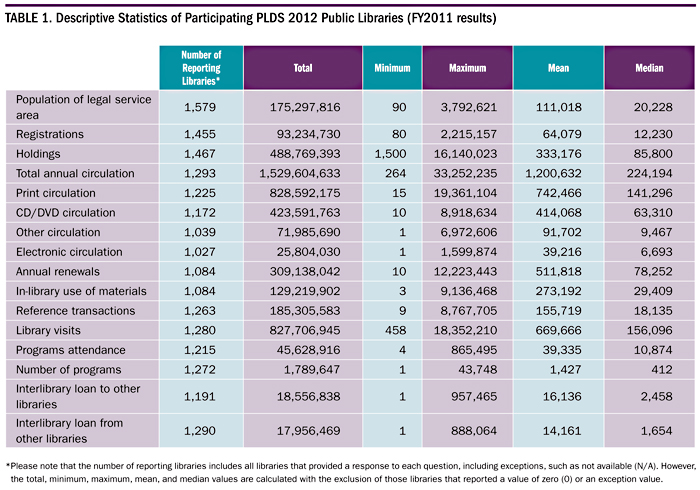
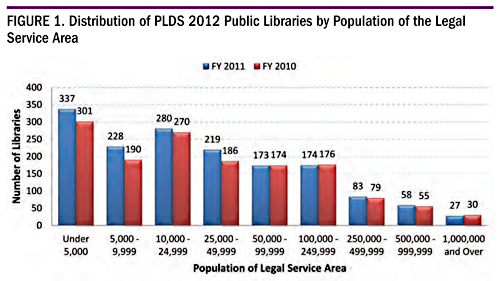
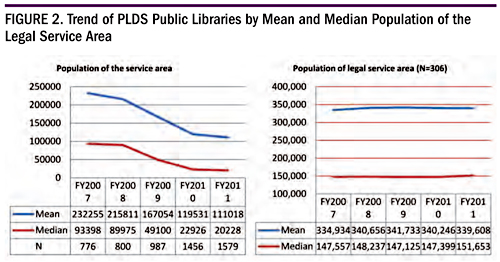
The latest FY2011 results include 1,579 responding libraries, just over 8 percent more than the FY2010 response count, providing their population of legal service area. Table 1 shows that the range of the size of population served was from 90 to 3,792,621 people. The distribution by groupings of the population of legal service area is shown in figure 1. As was found last year, there was a notable increase in the number of participating libraries that serve a population of legal service area less than 50,000 people.
For those participating libraries that reported both their population of legal service area and the number of registrations:
- Overall, 1,455 libraries offer services to a total population of 175,297,816 people and serve 93,234,730 registered borrowers.
- Overall the ratio of registrations to population of the legal service area is somewhere between six and seven people registered out of every ten people, as depicted in figure 5.
- For those libraries with populations of less than 50,000 people, these 963 libraries offer service to a total population of 13,451,047 and serve 8,342,742 registered borrowers.
- For those libraries with populations of 50,000 or more people, these 492 libraries offer services to a total population of 151,500,673 and serve 84,891,988 registered borrowers.
Some libraries may have reported a higher number of registrations than the actual number of people in their population of legal service area and have noted that their 2010 census was no longer accurate due to rapid community expansion and growth.
Population
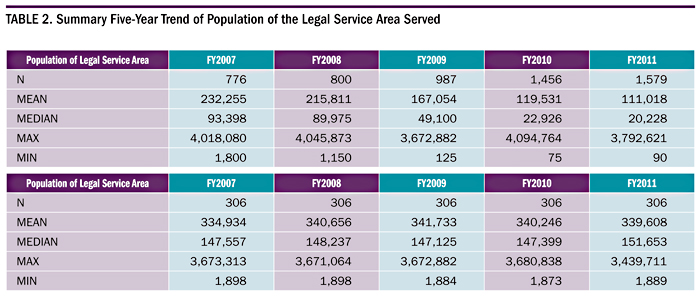
Throughout most of this discussion, population of legal service area will be used as the basis for grouping results and also as a basis of several key ratios. It is important and useful to note, especially when comparing results between each population group and when comparing year-over-year trends, that the sample of responding libraries is mostly variable from year to year and within each population group. Recognizing this variability, this discussion includes trends and comparisons for 306 libraries that have consistently participated in each survey conducted by PLDS in the last five years (FY2007 to FY2011).
Table 2 and figure 2 show population by legal service area adopted over the past five years. The trend report for all respondents shows an increasing number of PLDS public library participants from libraries serving smaller populations. In particular, this is noted by the drop of the average and median values prior to 2010 and the leveling off of these values between the last two years, where the size of sample has also increased to a lesser degree. This trend could indicate the growing importance of library metrics and the need for data across all public libraries. The second part of table 2 displays the data for the consistent participants and the values remain fairly stable.
Holdings
For FY2011, library holdings ranged from as few as 1,500 to as many as 16,140,023 items as reported by the 1,465 libraries that responded to this question, 61 more respondents than the previous year, and an increase of less than 1 percent of the total (485,641,446) reported in 2011.
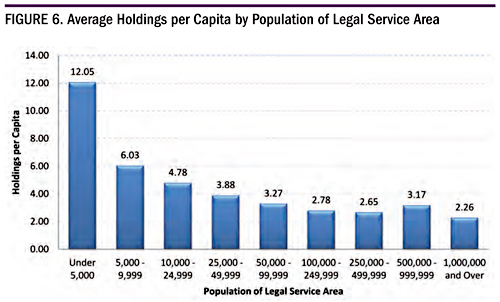
Figure 3 shows the trend for the last five years for holdings per capita. The first chart shows the trend for all PLDS libraries that reported and the second chart shows only those PLDS libraries (N=306) that reported data in each of the last five years. What seems apparent for all reporting libraries is that holdings per capita overall are increasing. But this result is more a function of the increased number of responding libraries that serve smaller populations of the legal service area. The median population of legal service area in FY2007 was 93,398 and this year the median value was 20,228. Generally these smaller libraries have larger holdings per capita each. This skewed relationship is also shown in figure 6, but this data is from the FY2011 only. Overall, year over year the marginal decrease in the average and median reported population has been greater than the decrease in the average and median reported holdings, thus holdings per capita shows an increasing trend over the last five years.
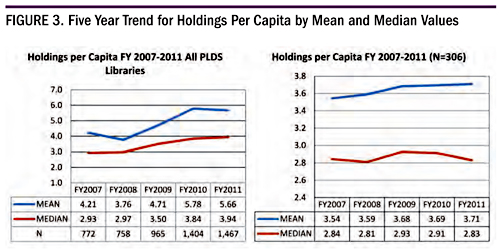
The second figure 3 chart shows holdings per capita for the group of libraries that reported consecutively in each of the last five years and these libraries have relatively stable holdings and an average that has slightly increased.
Circulation
PLDS libraries circulated items 1,200,632 times on average in FY2011, slightly higher than last year’s average, although fewer libraries this year reported their total annual circulation (1,069 reporting libraries, 0.09 percent fewer than last year). Total circulation of 1,529,604,633 was 1.12 percent less than the previous year. As in the previous two years the 2012 PLDS statistical report included circulation counts for independent types of materials. Of libraries reporting these counts, print items circulated 742,466 times on average, CD/DVD items were circulated 414,068 times on average, and all other materials were circulated 91,702 times on average.
Care should be taken not to compare this information with the total circulation results in table 1 since some libraries may or may not have reported their circulation counts for both total and independent types of materials.
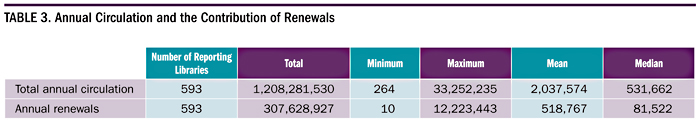
Table 3 takes a look at those libraries that reported both total annual circulation and the contribution of renewals to these circulation counts. For the 593 libraries that reported total and renewal circulation, total annual renewals on average accounted for 518,767 or 24.4 percent of the total annual circulation.
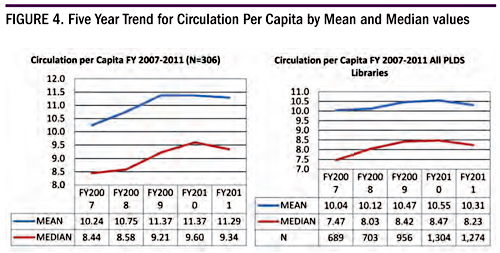
PLDS trend data (see figure 4) shows that the circulation per capita has on average generally increased from FY2007 through FY2010 and has retreated in FY2011 to below-2009 levels. Similarly for those libraries (N=306) that reported data in each of the past five years, circulation had increased between 2007 and 2010, the period during the world financial credit crisis, and also shows a decrease in 2011, to a level below the 2009 average.
Meanwhile, in general as table 1 shows, materials used in the library accounted for 273,192 (N=473) uses on average, 12 percent less than that the average calculated last year (average uses of 309,926, N=471). Interestingly, electronic circulation accounted for 39,216 circulation counts on average, compared to 18,804.4 in fiscal year 2010. In the previous year’s survey 1,162 libraries reported electronic circulation and this year only 658 libraries reported electronic circulation. So, although 43 percent fewer libraries reported electronic circulation, the 57 percent that did report, these libraries circulated on average twice as many e-materials compared to those in the previous year.
Similar to the findings from last year’s survey, the average values for library visits (669,666), in-library use of materials (273,192), and reference transactions (155,719) were each lower. These lower averages are again likely due to the change in population sample having a 12.4 percent increase in libraries with legal service areas of 50,000 or less. Interestingly, while the average number of programs (1,427) also decreased, the average program attendance (39,335) increased. Similarly the average number of materials sent to other libraries (16,136) and those received from other libraries (14,161) both increased compared to the previous year.
Selected Library Metrics by Population
Figures 5-9 provide a visualization of several library measures reported as a percentage of population of legal service area.
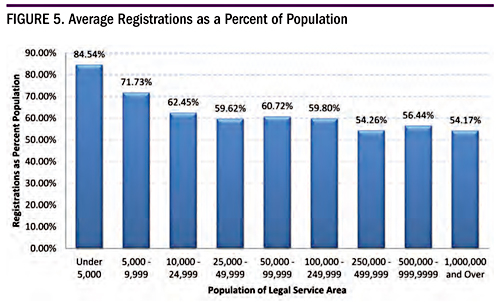
Library registrations as a percent of population, in the previous year showed a smooth curved relationship that as the population size increased the percentage of registrants decreased. This year’s results demonstrate a similar relationship but suggest there are tiered plateaus. The most significant marginal change in the average registrations occurs between the two smallest population groups. Then a similar marginal decrease of the average registration occurs and the first plateau is reached for the population groups between 10,000 to 249,999 persons. A smaller marginal decrease in average registrations occurs and another plateau is reached for the population groups between 250,000 to 1,000,000 and over.
Libraries with legal service areas with fewer than 9,999 people tended to register a larger proportion of the population.
Average holdings per capita show a very similar pattern as in previous years (figure 6). For example, as observed in last year’s report, libraries serving populations below 5,000 had average holdings per capita over five times those of the largest libraries. The overall average holdings per capita for all reporting libraries was 5.66 (N=1,467). This value is more than 2 percent lower than last year. This again is mostly due to the increased number of participating libraries serving the smaller population groups less than 100,000 people in size.
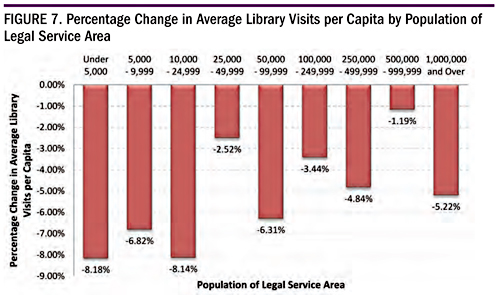
Library visits per capita continue to show the highest numbers for libraries serving smaller populations. The smallest libraries saw an average of 3.83 more visits per capita than libraries serving over 1,000,000. All libraries serving populations under 100,000 saw an average of at least 6.04 visits per capita annually.
However, overall the average library visits per capita for all reporting libraries was 6.61 (N=1,236) showing a 5.84 percent decrease from last year. Figure 7 shows that the largest decrease was reported by the smallest libraries serving populations of less than 25,000 people, and there were more libraries in this segment that contributed data this year which might account for some of the overall decrease. But, a decrease in average library visits per capita was reported by all libraries (figure 7). The general decrease may be attributed to increased use of remote or online library services including reference services, downloadable materials, and online databases.
In-library use was reported by the fewest number of libraries (N=473). The largest in-library use of materials was from libraries serving populations of 0 to 5,000 and 5,000 to 9,999. However the third largest number was for libraries serving a population of 1,000,000 and over with middle sized populations having the smallest values. The pattern for this statistic continues to change from year to year without any apparent consistency or relationship. This may be a result of the challenges libraries have in consistently tracking these numbers.
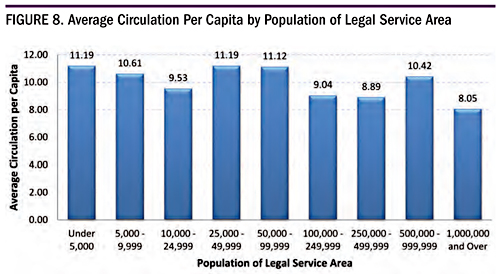
Average circulation per capita, despite showing the smallest value for the largest population group and the largest value for the smallest population group, there is no clear pattern between each population group (figure 8). The average circulation per capita for all reporting libraries was 10.32 (N=1,294). This, as shown in figure 8, is a decrease from the average of last year, and consistent with a decrease in the average for circulation per capita for all repeat responding libraries (N=306).
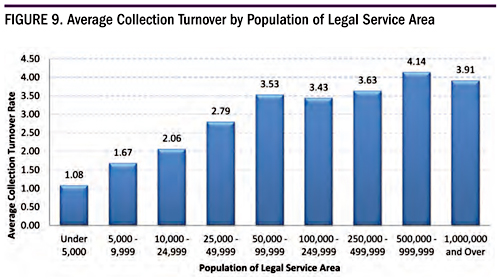
Collection turnover allows a library to see how often items within the collection are used by dividing the total circulation by the total holdings. When analyzing collection turnover (figure 9) larger population libraries have a larger average collection turnover than smaller population libraries, with the largest collection turnover for libraries serving a population of 500,000 to 999,999 and the smallest collection turnover for libraries serving a population of 5,000 to 9,999 (a 3.83x difference). The overall average for all reporting libraries was 2.54 items circulated per item held (N=1,234).
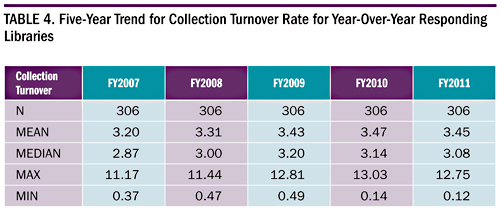
Table 4 shows a five-year trend for the collection turnover rate for those PLDS libraries (N=306) that have reported in each of the past five years. The turnover rate shows a softening of circulation transactions relative to the size of the holdings, relative to previous year results.
Operating Finances
Income and expenditure measures continue to provide useful operational insights for many libraries and are therefore a major section within the PLDS report and all library statistical reports. The average overall respondents’ library income was $4,892,178 per year or $46.68 per capita of the legal service area (N=1,576), a decrease of $2.74 from last year’s average per capita income of $49.42. Library expenditures, however, were $4,657,232 on average per year or $41.95 per capita of the legal service area (N=1,428). This is a decrease of $3.55 per capita from the average of $45.50 per capita expenditure in fiscal year 2010. The most notable change was a decrease seen in the under 5,000 population group, which saw a decline from the previous year’s increase in average income per capita. The 10,000 to 24,999 population group also saw a decline from the previous year while the remaining groups saw their average income per capita remain relatively stable from the previous year. This holds true with the previous year’s trend of individual libraries.
Overall the average income and expenditures for libraries decreased in FY2011. For the most part, income appears to be unchanged for most population groups, except for the first and third smallest population groups which show decreases in average income per capita of over 14 percent (figure 10) with similar decreases in expenditure (figure 11). Income and expenditures per person were largest for the libraries serving middle-sized populations from 25,000 to 49,999 followed by those serving populations of 50,000 to 99,999 and smallest for libraries serving the largest populations. Unlike the previous two years, the total average income did exceed total average expenditure for the largest population groupings (libraries serving more than 500,000), but only by a small margin. The other population groups (as shown in figure 12) have wider margins between the average income and expenditures per registrations and per capita.
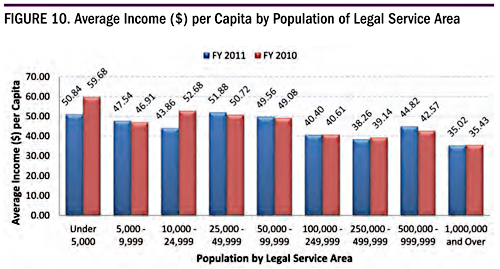
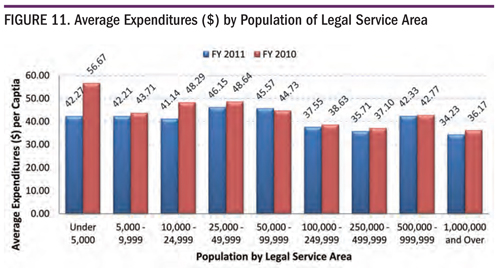
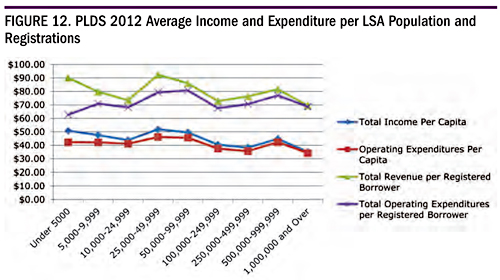
Figure 12 also shows a similar pattern of income and expenditure per registrations (top line pairing) and per capita (bottom line pairing).
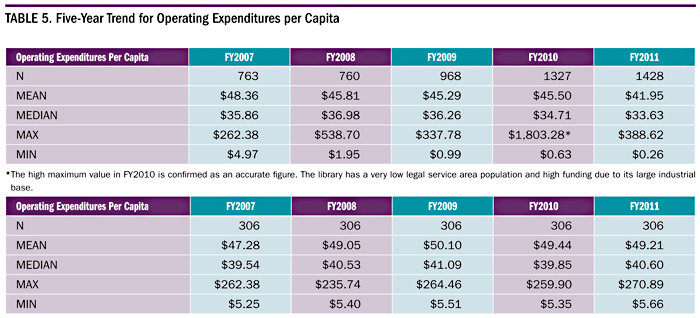
Table 5 shows the trend for the last five years for operating expenditures per capita. The first table shows the trend for all PLDS libraries that reported and the second table shows only those PLDS libraries (N=306) that reported data in each of the last five years. Among the consistent contributors operating expenditures have been more consistent hovering around $49 on average for the last four years. The median values for this group increased by $0.75 over FY2010 values.
The PLDS survey collected total materials expenditures and again provided the option for materials expenditure to be divided into categories by type of material. Overall, libraries spent $5.04 per capita on materials (N=1,430), with a range of $0.00 to $80.24. This change also represented a decrease of $2.84 over last year.
Figure 13 shows the five-year trend for materials expenditure per capita for those 306 libraries that have responded to the survey in each of these years. The average and median show a general decreasing trend for materials expenditure per capita. For this group of libraries the average population reported has actually decreased in the past two years, suggesting that the expenditure on materials has had to similarly decrease for this ratio also to decrease. Given indications of lower total expenditures for all population groups (figure 11), materials expenditure has also contracted with the overall decrease in spending.
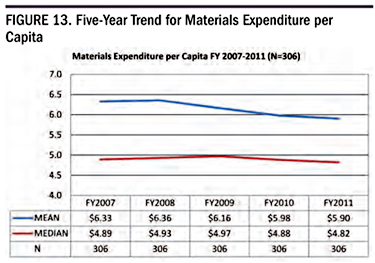
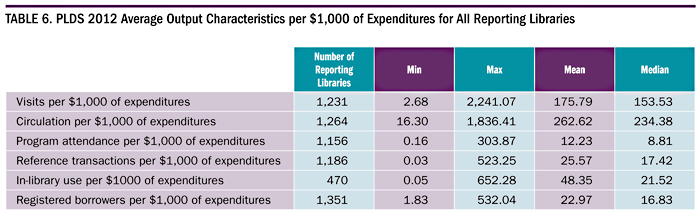
Table 6 summarizes various library outputs as a function of expenditure. In FY2011 per $1,000 spent, libraries on average realized:
- 176 library visits (179, 168, 149 for the prior three years);
- 263 materials circulated (260, 254, 235 for the prior three years);
- 12.23 patrons attend programs (12.1, 10.5, 9.0 for the prior three years);
- 25.57 reference transactions fielded (25.3, 26.9, 29.0 for the prior three years);
- 48.35 uses of materials within the library (47.2, 49.1, 48.0 for the prior three years); and
- 22.97 new registered patrons (20.0, 18.5, 17 for the prior three years).
Reference transactions per $1,000 spent stabilized this year and did not continue to decrease and overall there is an emerging trend of increased circulation and new borrower registrations per $1,000 spent over the past four years. These improved observations, however, are due to a simultaneous general decrease in expenditures, and this is confirmed by the fact that reference transactions, circulation, and registrations are also generally lower this year compared to last. Library visits have also dropped from last year but overall are still higher than previous years.
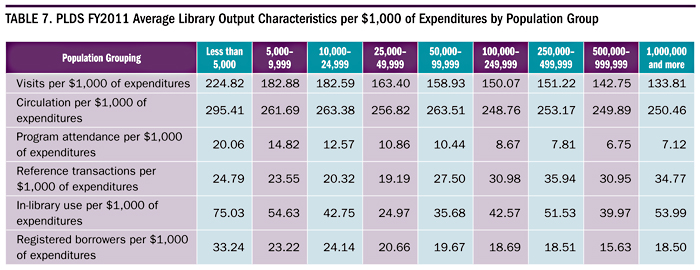
Program attendance is overall increasing while use of material within the library is slightly declining over the four years. Table 7 shows a variety of output measures expressed as an average per $1,000 of expenditure by population group. For each characteristic the outputs per $1,000 expenditure are varied with respect to population grouping. This variability is due to simultaneous decreases in both the output and input measure (expenditures). If the output measure (denominator) has decreased in proportion more than the input measure (numerator) compared to the previous year, then the ratio would suggest better performance. What is unclear from the analysis is degree to which lower expenditures (figure 13) are the result of improved efficiency or simply a reflection of tightened spending (lower income), see figure 12. A decrease in output measures could suggest that decreased spending has a detrimental impact on the volume of outputs produced.
Technology
Technology questions remain an important part of the PLDS survey which reflects the importance of technology in the modern public library. This year, the PLDS survey was altered slightly to include questions regarding e-readers and tablets while removing questions regarding CD and DVD players, to remain current with activities taking place at the library. Questions on social networking were amalgamated to keep better statistical and comparative results as social networking sites individually may change and use may rise and fall with current popularity.
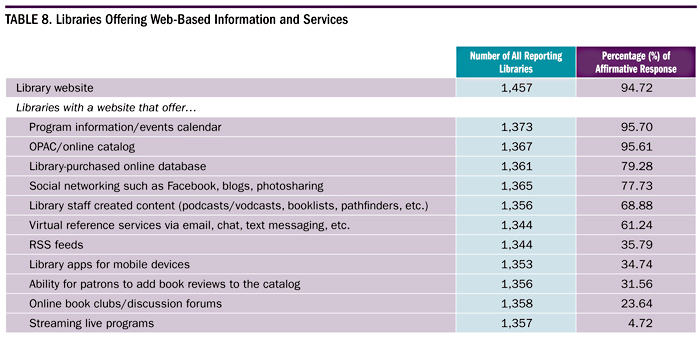
It is no surprise that more than 95 percent of libraries with a website include information on programs and events, as well as access to the OPAC (as shown in table 8). Not too far behind (at more than 79 percent) is the inclusion of online databases, and among the new technology questions, almost 78 percent of libraries include social networking features in their online presence (N=1,365). Rounding out the top six online resources is library staff created content (68.88 percent) and virtual reference services (61.24 percent).
Virtual reference service, however, was another question that was reformatted and combines the previous year’s separate questions into one general question. This year’s result shows a slight increase (+2.14 percent)from last year where 59.1 percent of libraries provided some form of virtual reference.
Regarding tablet circulation, 47 libraries indicated that they do circulate tablets, 3.2 percent of all 1,459 responding libraries. This will be an interesting question to follow in the 2013 survey as an indicator of technology adoption and the priority libraries are placing on it.
Other results include 13.2 percent of libraries using automated materials handling systems such as book sorters, automated check-in devices, and so forth. (N= 1,469); 85.2 percent of libraries did not circulate e-book readers (N=1,463).
Some libraries support mobile computing and devices, with 34.7 percent of libraries offering library apps that are accessible on a mobile device (N=1,353).
Special Section: Young Adult Services
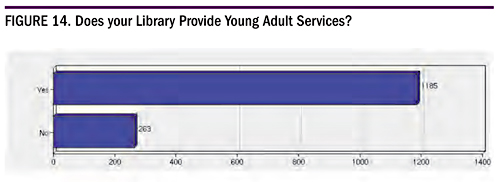
Each year PLDS focuses on a specific topic outside of the standard questions. For 2012, the focus was on young adult (YA) services. Of the 1,448 libraries who answered the question “Does your library provide YA services?” 81.8 percent answered yes (see figure 14). Of those 263 libraries that do not offer YA services:
- 46.6 percent serve a population of legal service area of fewer than 5,000;
- 23.7 percent serve a population of legal service area of 5,000 to 9,999;
- 17.3 percent serve a population of legal service area of 10,000 to 24,999; andthe remaining 11.4 percent of these respondents serve a population of legal service area of 25,000 people or greater.
While a significant number of libraries within the smaller population groups do not offer YA services, more than half of the libraries in this group (57.2 percent) do offer YA services.
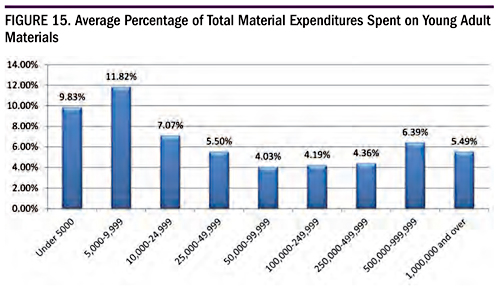
As expected, average expenditures on YA materials for FY2011 and FY2010 display a clear tendency for larger libraries to spend more than medium and smaller libraries. But as a portion of total materials expenditures (figure 15), the smaller libraries dedicate a larger portion of spending on YA materials than their larger counterparts. Generally, libraries that serve populations of 10,000 people and above spent between approximately 4 and 7 percent on YA materials as a portion of their materials expenditure. The smaller libraries serving populations below 10,000 people spent more than 9 percent of their total materials expenditure on YA materials.
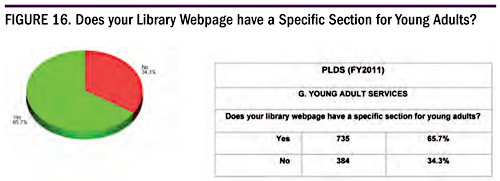
It is not surprising that of those libraries that do offer YA services, 65.7 percent have a specific section for young adults on the library webpage. For those 384 libraries that do not have a specific section for young adults on their webpage, they do have a presence on social network sites:
- 12.6 percent indicated that they have a social web presence;
- 25 percent indicated they have a presence on Facebook for young adults;
- 5.8 percent indicated they have a presence on Twitter for young adults; and,
- 5.8 percent indicated “other” social networks (such as Flickr, Pinterest, Google+, and Tumblr) where they have a presence for young adults.
Future Directions
The 2013 PLDS survey will run from January to April 2013 and will include a special section on library facilities, which has not been covered since the 2009 survey. Any library not receiving an invitation is encouraged to contact PLA or Counting Opinions (SQUIRE) Ltd. (pla@counting opinions.com) for more information. The PLDS will continue to collect data on library trends, including technology trends within the library. PLA strives to produce a survey that captures timely, relevant data and encourage libraries to use this data to enhance their decision-making processes. We also want to thank all of the responding libraries who took the time to participate. Contact us at pla@ala.org with comments or feedback.
Editor’s note: PLAmetrics is your portal to the Public Library Data Service (PLDS) Statistical Report digital database. Visit www.plametrics.org to subscribe.
Tags: PLDS