Taking Stock: Shelf Space and Allocation
Baltimore County (Md.) Public Library (BCPL) has seventeen branches, aged from one year to many decades old. When a branch is built, we purchase enough of each type of shelving to hold the projected collection, based on types of material. Each new branch is designed to hold a specific collection size. Over time, even with weeding, collections tend to mushroom in some or allareas. Shelves become so full that merchandising is ineffective and browsing is difficult.
For the newest branches, we knew the amount owned of each type of shelving and the correct initial collection size. In the older branches, though, much had changed since we planned the shelving and the correct opening-day collection size. These changes at BCPL included:
- the purchase, removal, or trading of shelving between branches;
- the availability of new material types; and
- growth of the collection from its original size if weeding did not keep up with new purchases.
In addition, BCPL started floating its collection three years ago so branches only temporarily own the items on the shelves. Finally, BCPL has two new sources of data: we changed to the Polaris ILS in December 2009 and introduced the CollectionHQ selection, management, and promotion tool in 2010.
Recent publishing and library trends have also changed requirements for materials. For example, the demand for audiobooks has exploded and almost every library needs to adjust shelving to allow for more of this very popular format. At the same time, the need for large reference sets has decreased almost to the point of non-existence, which has freed up areas that previously held that kind of material.
Given the many changes, BCPL needed to start over in determining the correct collection size for each branch based on its shelving. A project team was created to coordinate this effort. These are the steps the team took to complete this project:
- defined categories of shelving and procedures for measuring them;
- trained branch teams on how to complete the inventories;
- decided on assumptions to use in calculating branch capacities;
- calculated branch collection capacities; and
- determined and communicated responsibilities and procedures for ongoing updates and use of inventories.
Taking Inventory
Defining the Categories of Shelving
Creating inventory templates for shelving was complicated by the many types of shelving owned, the special uses of some shelving for particular types of materials, and how much shelving had been moved and changed over the years. To determine categories of shelving, each project team member visited one or two branches and took pictures of the shelving for every category of material that the collection development department purchases. The project included only shelving used for permanent storage of materials, not display shelves where materials may only reside temporarily. Also, we excluded our mobile library vehicles and special collections such as local history rooms.
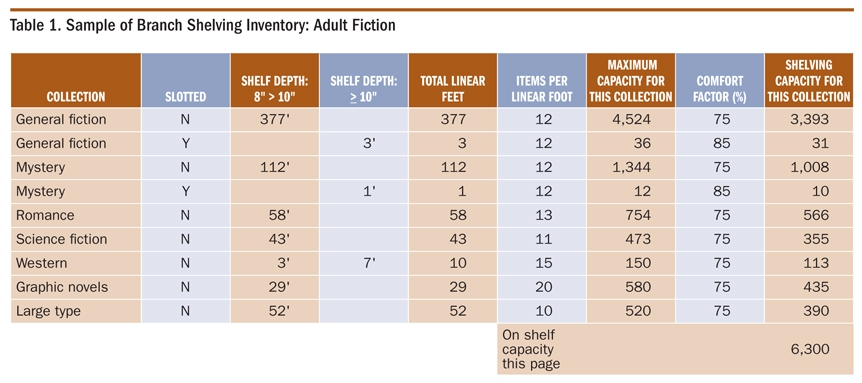
The project team viewed the pictures and decided how to narrow all the types of shelving into several categories. A sample of a branch’s shelving inventory worksheet for adult fiction is shown in table 1. The shelving categories appear in the first few columns. Not shown on this example are columns we included on the inventory for narrower shelving and notes. After some discussion, we decided that it wasn’t necessary to differentiate between similar shelving that is slanted or not slanted. The rows on the inventory sheet are the collection areas or categories by customer age and type of media. The inventory sheet shown is just one page of several in the Microsoft Excel workbook that comprise the inventory for each branch.
Materials with unique formats, such as music CDs and magazines, are on dedicated shelving and were treated differently in the inventory. For audiovisual, we asked the branches to tell us how many items fit in the units they are using. Similarly, we needed to know only how many magazine titles fit on that shelving, rather than the number of issues.
Training and Completion of Shelving Inventories
Each branch designated two or three people to complete the inventories. We determined and documented procedures for the branches to follow, such as:
- Include seasonal items with the general collection with which they are associated, such as children’s music CDs or general fiction.
- Measure from the inside of one side panel to the inside of the other side panel. Measure the entire shelf even if there are built-in removable bookends
that take up some of the length.
Each project team member visited two or three branches to train staff on completing the inventories. Branches had about two months to finish the task. The
project manager reviewed the submitted inventories and resolved any omissions or questions.
Assumptions for Calculating Branch Capacities
Once we had received the inventories, the project team had to agree on several assumptions. Calculating the correct collection size for each branch required us to consider the number of items per foot on shelves, the shelving comfort factor, and the percentage of the collection that is out at any given time.
Number of Items per Foot
To calculate the number of items that would fit on shelving, we needed to know the number of items per foot for each part of the collection. The number of items per foot multiplied by the linear feet of shelving for a collection is the capacity for that collection. We had some old documents that had been used for planning branches that noted items per foot for various collections. However, we decided to update those figures, given the changes in library materials. Each project team member measured items per foot for every type of material for which there is a row on the inventory. The group then agreed on averages to use for each material type.
Comfort Factor
The phrase “comfort factor” comes from the PLA book Managing for Results.1 It refers to the percentage of items physically in place that allows for shelving ease and merchandising. Based on experience, we decided on a comfort factor of 85 percent for collections on slotted shelves using dividers and for capacity-only units (except for magazines). We used a 75 percent comfort factor for collections on all other shelving to allow for merchandising space. When you multiply the total capacity of a shelf by its comfort factor, you reduce the number of items that can be housed.
Percent of Collection That Is Out At Any Time
If some of the collection is always checked out, then the official collection size for a branch can be larger than what will fit on the shelves. We started with the assumption that one-third of the collection is out at any given time, based on BCPL’s experience. This assumption proved to be quite accurate, as described under “Comparison of Capacity to Collection Size” in the section ahead.
Calculation of Branch Capacities
To calculate branch capacities, we added the following columns to the inventory sheets, allowing for the factors previously mentioned:
- items per linear foot;
- maximum capacity for this collection (items per linear foot × total linear feet);
- comfort factor; and
- shelving capacity for this collection (maximum capacity × comfort factor).
For audiovisual material and magazines, we simply multiplied the maximum capacity by the comfort factor to calculate the shelving capacity for those collections. On the final sheet of the workbook, a formula adds the shelving capacities for all the collections and multiplies that total by the “percent out” assumption to get the total number of items that can be assigned to that branch at any time. For example, if the total shelving capacity for a branch is 50,000 and one-third of the collection is out at any time, then the number of items that can be assigned to that branch is 50,000 × 1.5 (the reciprocal of one minus one-third).
Comparison of Capacities to Collection Size
Once the branch capacity calculations were completed, we needed to compare them to the actual collection size at each branch. The data from the ILS, as well as our experience with the branches, caused us to adjust the assumption we had made for every branch that 33 percent of the collection is out at any time. We changed the assumption for four branches: two to 25 percent, one to 40 percent, and one to 45 percent out. The revised calculations for some of the branches can be seen in table 2.
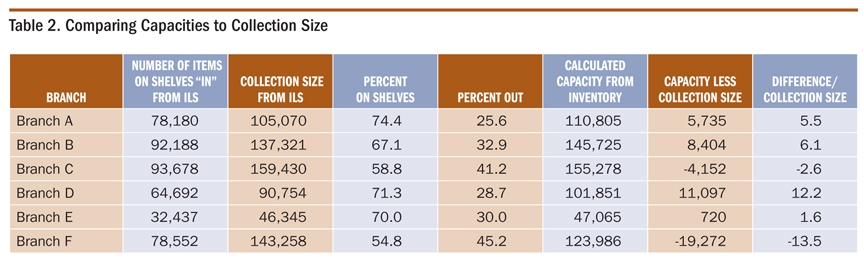
By looking at the last column in table 2, it is clear that some branches (Branch E) have collection sizes very close to their capacity — the percentage difference is very small. However, others such as Branch D have more shelf space than their current collection size requires so the percentage
difference is significantly positive. These branches have greater flexibility for rearranging collections and merchandising. The collection size at Branch F is considerably larger than its calculated capacity, resulting in the percentage difference being significantly negative. This branch is chronically short on space.
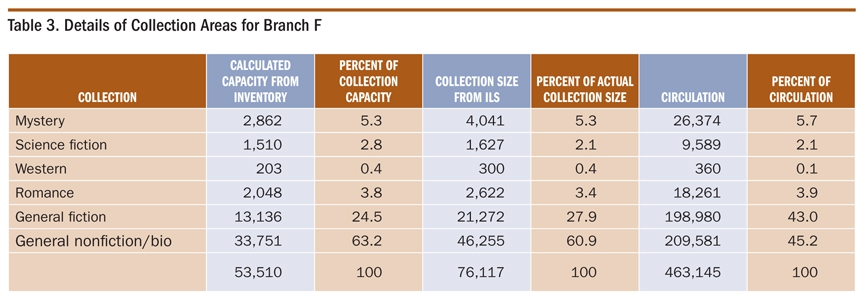
When a branch’s collection size is significantly over its capacity, the first step is to look at details for the various collection areas of that branch. A portion of the analysis for Branch F is shown in table 3. All areas shown have a larger collection size than the capacity calculated from the inventory. The primary focus for reducing the collection would be in nonfiction, since the percentage of circulation for that part of the collection (45.2 percent) is so much lower than its percentage of the collection (63.2 percent). In addition, we know that our collection development department is buying less nonfiction as customers get more information from the Internet.
Even when the total capacity and collection size are close, as at Branch E (see table 2), we wanted to analyze each branch more closely. We did a detailed analysis for each area of the collection comparing capacity of shelf space allocated to actual collection size and circulation. Analysis of all branches’ statistics by collection area highlighted some commonalities:
- Fairy tales, juvenile fiction, and adult nonfiction had too much shelving space allocated compared to their collection size and circulation.
- Beginning readers and first chapter books had too little shelving space allocated compared to their collection size and circulation.
While this information shows us where to focus weeding and space reallocation, we recognize that there are still constraints of building layout. For example, we can’t move very efficient, high-circulating children’s materials from a clearly delineated children’s section of the branch to the adult is too crowded and the nonfiction area has excess capacity. In addition, sometimes we can’t reduce or increase space for a collection if it means crossing a break in the aisle, turning a corner, or finding a small collection to go into freed-up space.
Ongoing Use of the Shelving Inventory
The collection development department will coordinate and monitor the updating and use of shelving inventories. The project team documented the following decisions:
- Branches will use the shelving inventory information in conjunction with actual collection size and circulation. Ideally, branches will use the information provided by collection development and compare small groupings of the collection which share similar shelving and location and can be targeted for shifting or aggressive weeding.
- A branch representative will be responsible for updating inventories every six months or sooner if major changes occur.
- Branches will use the shelving inventory information when planning space for renovation or major shifts in the collection.
- Collection development will recalculate the percentage out and circulation for each branch’s collection once a year using existing formulas.
- Collection development will use this information when collaborating with branches to determine how to best allocate space to maximize popular collections. Staff will use the information to highlight underperforming collections which have an unbalanced shelving allotment relative to circulation.
- Collection development will prepare spreadsheets of the small collection analysis (see table 3) for all branches to review. Their staff will update the spreadsheets every six months or so as the inventories are updated.
Staff will use three sets of numbers to make decisions for each branch about shifting and weeding of collections: the calculated correct collection size based on the existing shelving, and Polaris and CollectionHQ data about the productivity of each part of the collection. The shelving inventories will be especially helpful when purchasing new formats or when there is a need to increase buying in a particular collection area. Collection development will know whether branches can accommodate the additional material on the shelving they have. PL
Acknowledgements: The authors would like to thank the other project team members: Jo Pinder, BCPL assistant director; Jo Blankenburg, Amanda Myers, and Maureen Roberts; as well as Jamie Watson, BCPL collection development coordinator, for her contributions to this article.
Reference
- Sandra S. Nelson, Managing for Results: Effective Resource Allocation for Public Libraries (Chicago: ALA, 2000): 218.