Remaking One of the Nation’s Busiest Main Libraries
Are you satisfied with your main library’s service model? Is your main library organized in a way that matches how your customers use it? Do you wonder if it’s time to try something different? If so you are not alone. The Public Library of Cincinnati and Hamilton County (PLCH) faced these questions and decided it was time to make a change.
Walking into the main library in downtown Cincinnati just barely three years ago, you would have seen a starkly different landscape. Reference librarians staffed desks in disparate subject departments, waiting for reference questions on such topics as science and technology; literature and languages; or education and religion. The building was full, and all the computers were taken. But there was a growing gap between the customers using the main library and the staff at the desks. A gap, it seemed, between the customers and the building itself.
“Why would we need to change? If it isn’t broken, don’t fix it. Everything is just fine the way it is. We aren’t doing anything wrong.” When PLCH assembled the Main Library for the 21st Century (ML/21) project team to evaluate the main library’s fifty-year-old department style and subject-focused service structure, there were a lot of these kinds of comments. At that time, the main library, with its fifteen separate departments, circulated more than four million items a year. A million customers walked through the doors annually. Everything was just fine. Or was it?
Despite these traditional signs of success, pressures were mounting to add new services and streamline the existing ones. Public libraries across the nation were adding computers, new technologies, and library staff trained to assist customers with their technology needs. At our main library, however, technology access and staff support was lacking. Public libraries across the country were designing dynamic teen areas to entice a new generation of library users into their buildings. But our main library offered little more than a section where the teen books were shelved.
Additionally, PLCH had joined the ranks of public libraries with dramatically shrinking budgets, and doing more with less had become standard operating procedure. By the time the ML/21 project team held its first meeting in August 2005, the library had experienced a 10 percent reduction in its funding since 2000. During that five-year span hours had been reduced by 10 percent and staffing by 20 percent, capital projects had been canceled, and no area of the library had been untouched by funding-related reductions. To make matters worse, projections from the state were that funding would continue to drop for the foreseeable future. The time had come to figure out what our most relevant services were and to build a sustainable structure that focused on delivering these services to our customers.
Background
Building ML/21 presented several challenges for the project team to conquer. It was essential to take a fresh and honest look at customers’ needs and how customers interacted with the library. The main library had been built on a number of assumptions about how customers interacted with the library. It was becoming increasingly clear that despite assertions that we knew what customers wanted and needed, those assumptions were not based on data obtained by observing customers’ actual use of the library. We had to break free of the assumptions trap. We had to get it right and move toward a truly customer-oriented environment. But how to do this? Surveys, focus groups, and other traditional tools that gather and tabulate the opinions and experience of customers are helpful. They tend, however, to aggregate information about a particular subset’s use of the library, and they tend to be biased by the selfreporting process. They do not necessarily convey what kind of experience a customer has when using the library—and whether or not the model for providing service at that location is helpful or is working for them.
Budgetary constraints had to be considered. The project had to result in not only an alignment of the service structure and operations with current customer needs and demands, but it also had to improve operational efficiencies and reduce overall operational costs. As we proceeded, it became clear that it was critical that everyone on the project team be open to all ideas and thoughts. Everyone had to agree that nothing was sacred.
Data Gathering
Gathering real data about your customers and their use of your library truly is taking customer input into library service to the next level.
Where and how do you gather additional quantifiable data? What can and should this data measure for a project team to get a clear picture of how customers are using the library and how well the library’s service model is working?
The ML/21 team utilized a variety of standard data gathering tools to assess the current state of service. It was important to draw on every avenue that was available. Customer surveys were conducted, staff focus groups were held, managers from each of the existing subject departments were interviewed, and existing usage data such as circulation and reference question statistics were reviewed.
Our commitment to collecting hard data, however, led to an effort that turned out to be the most beneficial piece of the puzzle. We had determined that we needed to spend time watching our customers use our facility and watching what our customers were doing. The results were eye-opening.
A process for making careful and consistent observations of customer behavior was adapted from a study conducted by Christie M. Koontz, Dean K. Jue, and Keith Curry Lance.1 Each project team member, armed with an “observation sheet” walked through the entire main library during planned times and noted what customers where doing, where they were doing it, and how they were (or were not) interacting with staff members. These “unobtrusive observations”— conducted over the course of two months, on thirty-three different days, during different periods of the day—divided customer activities into twelve distinct categories. Customers were loosely categorized in the observation data by their estimated age (child, teen, adult, or senior). More than 23,000 customers were observed during the project. The observations were compelling.
Computer Usage
The results of observations revealed that computer usage was enormous. At any given time, 42 percent of visitors were using a computer while at the main library. Each subject department housed a certain number of computers originally intended for subject experts in each department to use for answering questions and assisting customers. But there was no difference in the hardware or software available on these computers regardless of location. Observations revealed that customers were using the computers for things unrelated to the subject departments in which the computers were located.
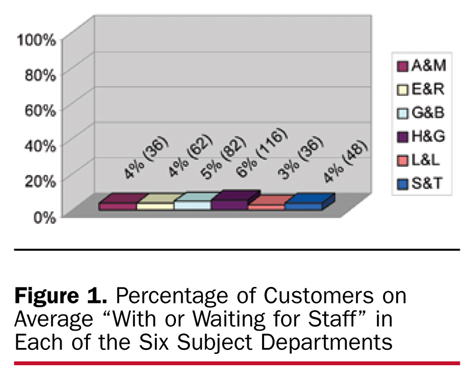
Staff Assistance
When customers were observed interacting with staff, ML/21 team members marked this activity in the “with or waiting for staff” category. Observations revealed that a surprisingly large number of our customers were not receiving assistance from any library staff members, particularly our highly trained subject experts (see figure 1). At our library, of the 23,000 customer cases observed, less than 10 percent of staff-mediated activity was occurring in our subject departments at any given time. There was a much higher interaction rate between staff and customers in our circulation department.
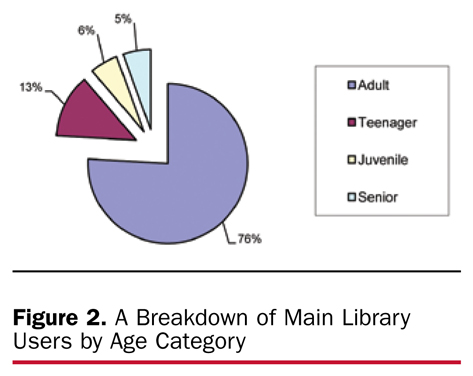
Visitors
It quickly became apparent that despite having given them no real space of their own at the main library, teenagers were the second largest users of the main library. More teens were using the library at any given time than the number of children and seniors combined (see figure 2).
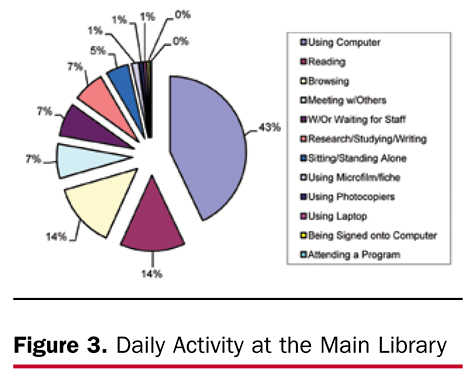
Browsing, Reading, and Studying
It isn’t flashy, but it turned out that the somewhat traditional act of browsing was still very much an activity many customers were consistently engaged in—as was reading. Figure 3 reveals that these activities were, to many team members’ surprise, second only to using the computer when it came to what customers were actually doing at our main library.
New Service Model
As a result of these findings, it was determined that a massive reorganization of the main library was needed. After lengthy (and at times heated) discussion, a new service model was developed. The model emphasized technology, convenience for the customer, and a service focus to meet the needs of today’s users. The following are the major changes implemented to achieve those goals.
Information and Reference Department
The most confusing element of the old model was the subject department structure. Six existed (art and music; history and genealogy; science and technology; literature and languages; government and business; and education and religion), with the entire adult nonfiction collection divided among the six. Without staff assistance, or a good working knowledge of the structure, it was at best a shot in the dark for a customer to pick the right department to begin his or her research. To add to the confusion and complexity, multiple stops would often be needed to complete one’s research, since many subjects crossed department lines. The creation of the information and reference department allowed for all reference activity to be funneled into a single unit. The adult nonfiction collection was reorganized, running in straight Dewey order on the second and third floors, making browsing of the collection easier and much more intuitive. And finally, reference staff were trained across all subjects, moving away entirely from the subject-specialist model that had existed for more than fifty years.
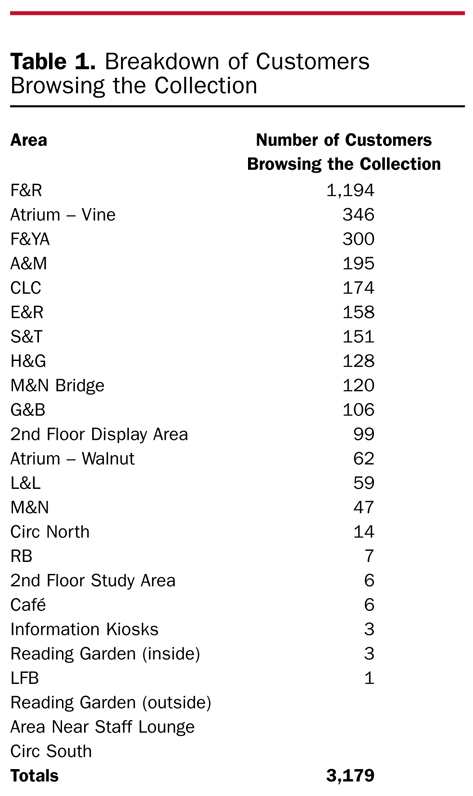
Popular Library
It was clear from a brief scan of the monthly circulation reports that a large portion of usage (40 percent) at the main library came from the circulation of fiction, bestselling nonfiction, and audiovisual material. Also, based on the observation data (see table 1), 58 percent of customers browsing the collection at the main library were doing so in the fiction, young adult, films and recordings, new adult nonfiction, and magazine departments. The popular library was created containing fiction, A/V, graphic novels for adults, large print materials, foreign fiction, English as a Second Language materials, and a sampling of new adult nonfiction books and magazines. The popular library serves as the “branch within a branch” at the main library, allowing for a quick lunchtime visit for many users who work downtown.
Teens
Designed with extensive input from teens, a new TeenSpot was created. With twenty-four computers, two quiet study rooms, a teen lounge (complete with vending machines and restaurant booths and capable of hosting large tours), programs and gaming events, a manga corner, and a large activity room, the TeenSpot is packed with teens on a daily basis.
Technology
With 42 percent of visitors at the main library using a computer, the centerpiece of ML/21 was the creation of a new TechCenter. One hundred PCs were installed, with each offering a wide array of software. The TechCenter is staffed with people who are knowledgeable, interested, and excited about technology— and about helping others with its use.
Study Areas
From the observation data we found that, 33 percent of visitors were found to be studying, reading, sitting alone or meeting with others. Spaces were carved out on each public floor with plenty of study carrels and tables all located near windows when possible, as we observed that people love to sit near a window.
Other Changes
In the old model, all phone traffic was routed to the public desk causing staff to constantly juggle phone and in-person customers. We moved all that remote activity off-desk, allowing staff, whether on the public floor or in a remote service location, to devote full attention to their respective customers.
And, since staff members were no longer “tethered” by phone cord to the service desk, we implemented proactive customer service (PCS), one of the most challenging pieces of the ML/21 service model. We also centralized collection development at the main library, installed self-checkout machines, created a genealogy and local history department, and created Homework Central, where staff and volunteers provide homework and tutoring assistance.
As you can imagine, the changes were tantamount to a major earthquake hitting Cincinnati and practically demolishing a building that had settled in for fifty years. It should go without saying that this was not an easy task, and while usage is up and public response positive, there were definitely bumps along the way and a fair share of naysayers.
However, the results are overwhelmingly positive. The main library is now poised to grow and meet the challenges of the twenty-first century. Every trip through the building is a reminder of just how much has changed. And now, how much things can continue to change for the better.
What Advice Would We Give?
Anyone looking to reorganize their own main library must acknowledge that things have changed drastically for public libraries in the last decade. If we are to remain relevant to our customers and communities, those working in and managing main libraries must react and respond accordingly.
When we began the ML/21 project we knew that our librarians and staff members would likely struggle with the proposed changes. Many of our main library staff members had worked in their respective subject departments for their entire careers. They were emotionally and professionally invested in the fifty-year-old main library service model and in their specific subject-department expertise. To ensure staff buy-in for possible changes, members of the ML/21 project team had to reflect the makeup of the entire main library staff. The team members included five managers (three with close to thirty years of experience each), two reference librarians, one children’s librarian, and two library services assistants. Having such a diverse, well-respected group was critical in gaining the acceptance of the reorganization proposals by all main library staff.
Another essential piece of the success of the reorganization of the main library was the conclusion that the recommendations from the project team had to be data-driven. Our ML/21 experiment began with the simple premise of finding out what the customers wanted from our PLCH main library and then building a service structure to provide it. We focused on quantifiable data and drew clear links from this data to our recommendations when presenting the new service model to staff members.
The ML/21 project dramatically changed the organization of the main library, the kinds of services offered to customers, and the way these services are delivered. Many staff members have embraced these changes. For others, the change was too much. A number of staff at all levels, including managers, have since left the library for other jobs. Some longserving and knowledgeable managers and staff members chose to retire or have moved on to pursue other opportunities.
The benefits of the new model are, however, impossible to miss on a daily basis. Aside from the creation of new departments and areas tailor-made to meet proven customer needs, the reorganization has saved the library approximately one million dollars annually. The walls and carpet were refreshed as a piece of the ML/21 implementation, and now the aesthetic feel of the main library reflects the dynamic service provided with vibrant paint and patterned carpet. Additionally, the dynamic, refreshed environment of the reorganized main library fostered a proactive service environment. This proactive approach to customer service has been formalized and main library staff rove throughout their departments continuously in order to deliver the most effective customer service at all times, to all patrons. Staff members are out roving the floors and meeting the customers where they need help. The TechCenter is busy, and the TeenSpot is full of anime, teens, and Guitar Hero. The headsets in the reference and renewal call banks are buzzing, and the library’s new text-a-librarian service is hopping. The days of quietly waiting behind the desk for that subject-specific reference question are over—and the twenty-first century awaits.
Reference
- Christie M. Koontz, Dean K. Jue, and Keith Curry Lance, “Neighborhood-Based In-Library Use Performance Measures for Public Libraries: A Nationwide Study of Majority-Minority and Majority White/Low Income Markets Using Personal Digital Data Collectors,” Library & Information Science Research 27 (2005), (accessed Sept. 15, 2010).