
The 2013 Public Library Data Service Statistical Report: Characteristics and Trends
The Public Library Data Service (PLDS) is an annual survey conducted by PLA. This 2013 survey of public libraries from the United States and Canada collected fiscal year (FY) 2012 information on finances, resources, service usage, and technology. Each year, PLDS includes a special survey highlighting one service area or public library topic. This year these supplemental questions focused on facilities.
PLA and Counting Opinions (SQUIRE) Ltd. continue to partner to provide the service for capturing the data and for the PLA metrics online portal subscription service—offering access to the longitudinal PLDS data sets going back to FY2002, and data from the Institute of Museums and Library Services (IMLS) going back to FY2000. PLAmetrics provides public libraries real-time access to meaningful and relevant public library data for comparing and assessing their operations using a variety of custom report formats and customizable report templates.
This report presents selected metrics for FY2012 PLDS data and previous year results in tables and figures with related observations. The results in this report were compiled using PLAmetrics.
Research Method and Context
Participation in the PLDS is voluntary and participants have the option of providing responses to any or all of the questions that comprise the survey. Similar to previous years, public libraries in the United States and Canada were invited to participate in the survey. Emails (3,430) were sent to launch the survey in January 2013, postcards were handed out at the 2013 ALA Midwinter Meeting in Seattle, follow-up letters and emails were sent throughout March and April 2013, and the deadline for submission was extended from March 15 to April 15. State data coordinators from the U.S. and provincial/association coordinators in Canada were contacted about promoting the survey to their libraries. Their involvement again led to increased awareness and participation, with 1,949 of American and Canadian public libraries partially or fully responding to the request for data, a response rate of 21 percent (a 1.3 percent increase over the previous year). However, due to the voluntary nature of this survey, several libraries had to be contacted for additional data resulting in 1,897 libraries included in the final data analysis. This is an increase over 1,579 from FY2011 and 1,461 from FY2010.
Please refer to the online PLDS Survey site for copies of the survey and definitions of questions.
Overall Service Summary
The PLDS Survey includes questions that effectively characterize the operations (input and output measures) of each responding library. Table 1 includes a selection of summary data representingall libraries that provided non-zero values for each selected measure.
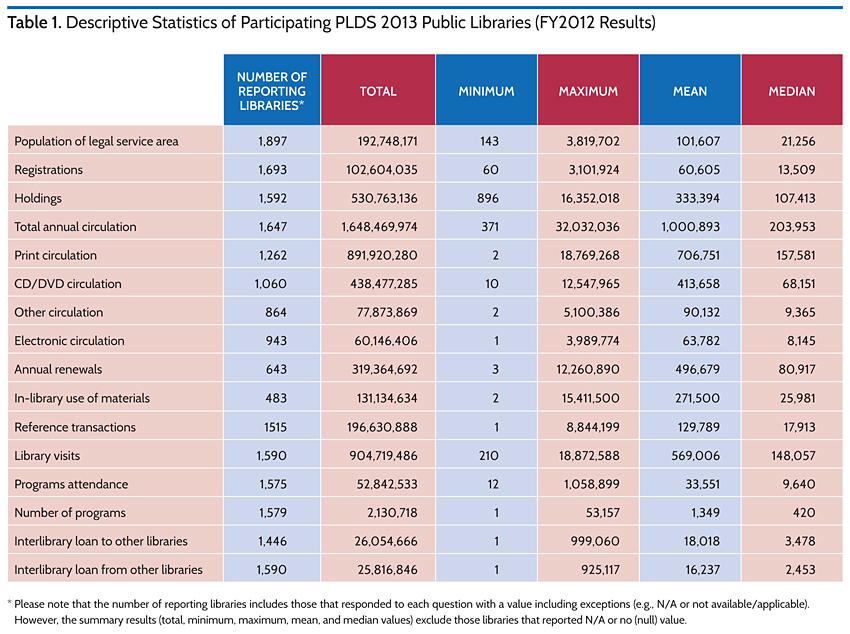 The FY2012 results include 1,897 responding libraries that reported their population of legal service area, a 20 percent increase compared to the FY2011 response count. Table 1 shows that the population served ranged between 143 to 3,819,702 with a mean and median population of 101,607 and 21,256 respectively. The results are characteristic of the overall composition of the PLDS FY2012 data set and these statistics are consistent with reality, whereby more than 82 percent of the reporting libraries serve populations less than 50,000. New this year is an increase in the number of participating libraries that serve populations of 50,000 or more (a 37 percent increase). For libraries serving populations less than 50,000, the increase in response rate is 14 percent more than last year. As a result of this increase in smaller libraries reporting data in FY2012, the mean and median values listed in table 1 have decreased. However, there is an exception of mean electronic circulation, which shows an increase of 63 percent overall and interlibrary loans (ILLs) to/from other libraries with modest increases in average and mean values compared to last year.
Population
Throughout this article, the population of legal service area is used as the basis for grouping results and for per capita ratios. It is important to note that the sample of responding libraries is variable year-over-year and within each population grouping. As such, we also include analysis of continuous responder data. This discussion includes trends and comparisons for the data segmented into either:
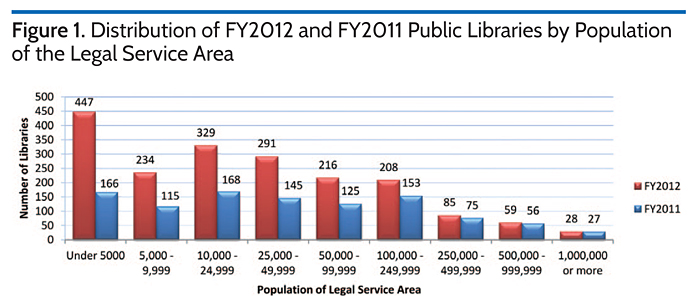 nine population of legal service area groupings (shown in figure 1); and/or
- as a group of libraries (N=352) that have consistently participated in each PLDS survey over the most recent three and/or five years (FY2008 to FY2012).
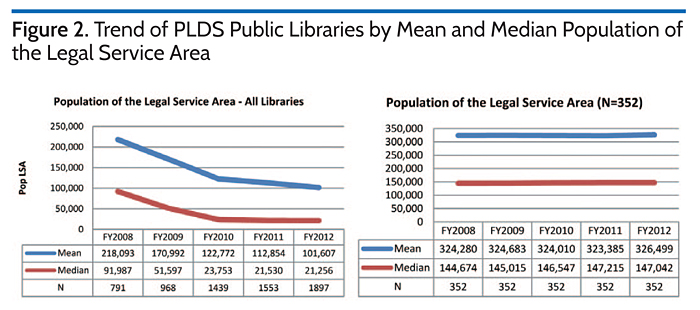
Figure 2 shows population by legal service area (Pop LSA) reported over the past five years. The trend shows an increase in participating public libraries that serve smaller populations, as evidenced by the lower mean and median values depicted in the last two years. The second part of figure 2 displays the Pop LSA data for the continuous participants, which highlights that the population for this group has not changed much over the past five years and therefore yield more consistent and comparable per capita metrics.
 Registered Borrowers
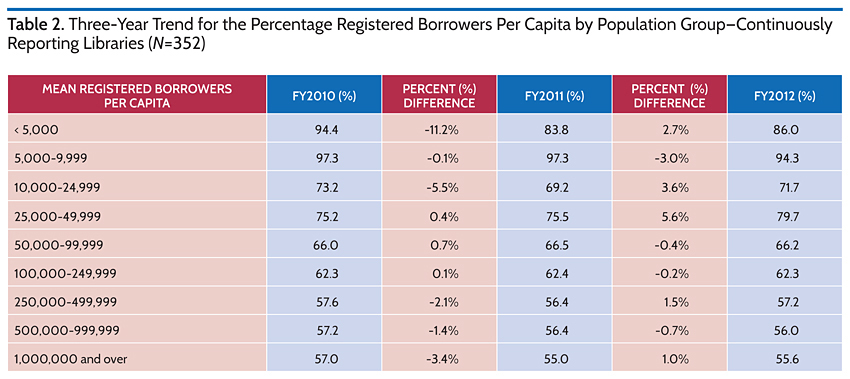
For the continuously reporting libraries, table 2 shows a 2.2 percent increase in the average number of registered borrowers per capita in FY2012 for libraries serving populations fewer than 50,000 compared to a 4.1 percent average decrease in FY2011. Libraries serving populations of 50,000 or more reported an average 0.2 percent increase compared to a 1.5 percent decrease last year. Overall registered borrowers increased by just over 1 percent for this group of libraries in FY2012.
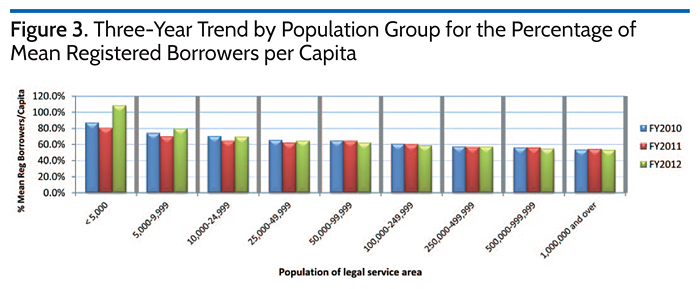 For all libraries reporting both their population of legal service area and the number of registrations, figure 3 shows a three-year trend for mean registered borrowers per capita by population group. For FY2012:
- Overall 1,897 libraries offer services to a total population of 192,748,171 including 102,759,178 registered borrowers (>71 percent of the population)
- For those libraries with populations less than 25,000, these 1,010 libraries offer service to a population of 8,008,103 including 4,976,573 registered borrowers (>82 percent of the population)
- For those libraries with populations more than 25,000, 887 libraries offer services to a population of 184,740,068 including 97,627,462 registered borrowers (>61 percent of the population)
Some libraries, particularly those serving fewer than 10,000, reported a higher number of registrations than the actual number of people in their population of legal service area. Differences in some instances are explained by:
- 2010 census figures are often no longer accurate especially in communities with rapid expansion or contraction;
- libraries may serve surrounding communities outside their LSA; or
- influx of temporary and/or semi-permanent migrant workers.
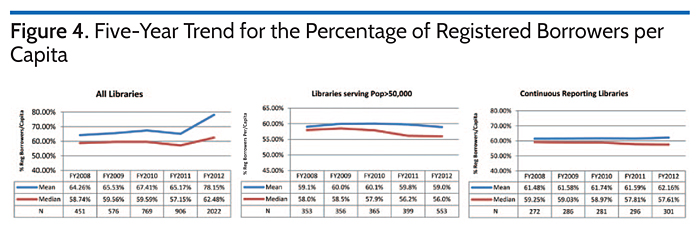
While library registrations showed a small overall contraction in mean registered borrowers per capita in FY2011, FY2012 results show an increase for libraries serving populations less than 50,000, but a decrease for libraries serving populations of 50,000 or more. The most significant marginal change occurred in population groups under 5,000, with a 36 percent increase. For continuous reporting libraries, the most significant increase is for populations between 10,000 and 49,999. Figure 4 shows the five-year trend for all libraries, those libraries serving populations of 50,000 or more (i.e., excludes those serving populations less than 50,000), and the continuous responding libraries. Filtering out the smaller libraries indicates that registrations per capita has risen and fallen ever so slightly during the last five years for the larger libraries (varies between 56 and 60 percent). Registered borrowers per capita for continuous reporting libraries shows a stable trend (varies between 57 and 62 percent).
 Holdings
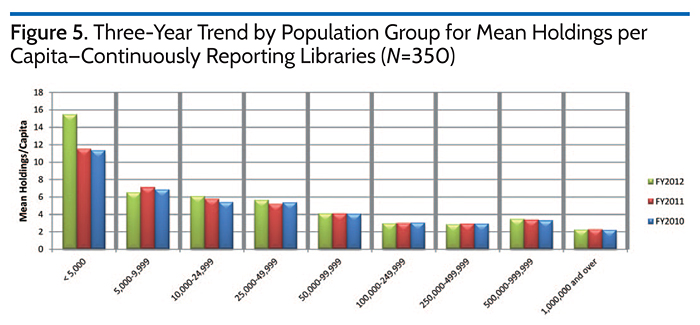
The three-year trend chart for mean holdings per capita, for continuous respondents, is shown in Figure 5 (note: reverse chronological order).
 The three-year trend for mean expenditures on holdings and e-materials, for continuous respondents, is shown in figure 6 (note: reverse chronological order).
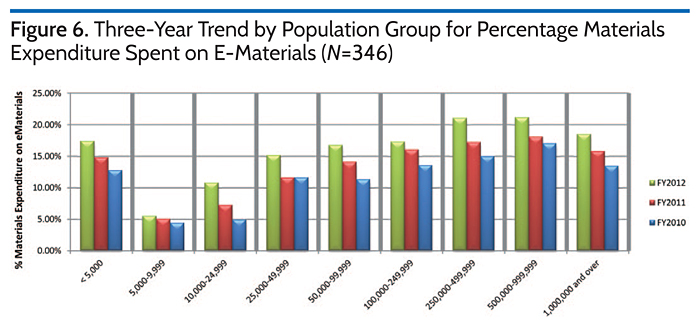 Despite an average 20.98 percent increase in expenditures on e-materials as a percentage of total materials expenditure, holdings per capita for the continuous respondent group increased overall by only 2.9 percent.
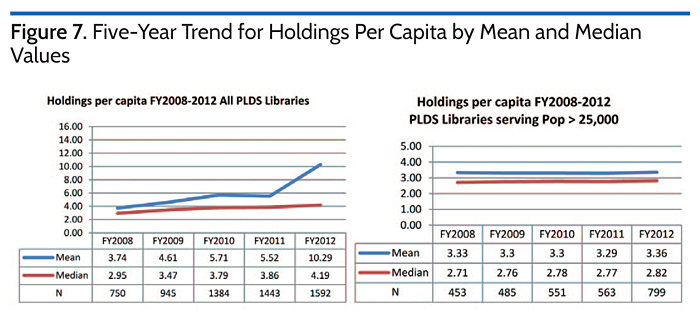
When viewing the results for all respondents, the average holdings per capita show a very similar pattern as in previous years (see figure 7). The average overall FY2012 holdings per capita for all reporting libraries is 10.29 (N=1,592). This value is 81 percent greater than last year. This is likely due to the increased number of respondents serving smaller populations (< 25,000). As shown in figure 7, filtering out these libraries (populations < 25,000) the mean and median holdings per capita over the past five years is very stable with slightly more than 2 percent growth, which is similar to the continuous responding libraries (2.9 percent).
 Circulation
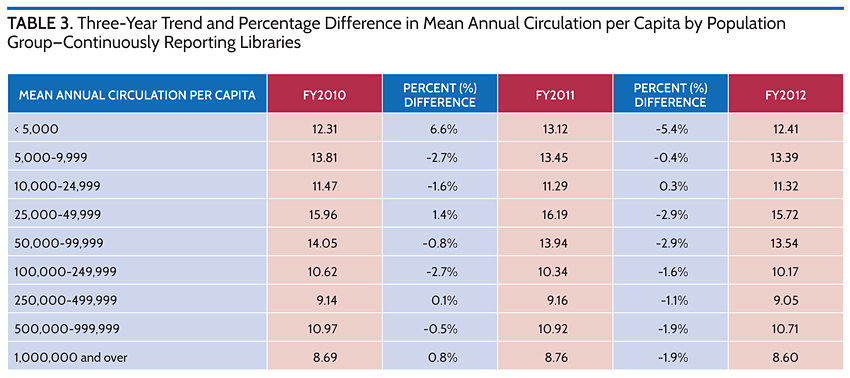
Continuous respondent libraries circulated about eleven items per capita on average in FY2012, 1.6 percent fewer than previous year’s average, as shown in table 3 by population groupings.
 Although 53 libraries within the continuous respondent group did not report electronic circulation figures, the 0.41 e-circulations per capita (an 86 percent increase from previous year) were insufficient to offset the apparent lower reported circulation per capita of physical materials. This reduced level of circulation activity likely coincides with the decrease in library visits (see Library Visits).
Figure 8 shows a similar pattern of lower circulation per capita for all libraries except for those serving populations of less than 25,000. Within this group, a 2.5 percent increase in circulation per capita was reported by continuous responders.
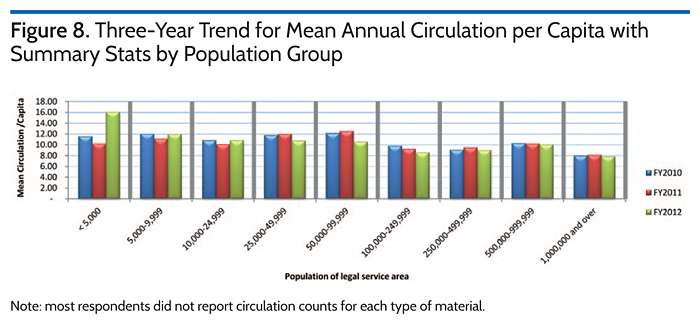 Table 4 summarizes the circulation per capita results for continuous respondents that reported circulation by item type, including electronic circulation (N=291). Print circulation accounted for more than 58 percent, CD/DVDs accounted for more than 34 percent, and “other” accounted for more than 5.8% of circulation. These results are similar to the proportions found in the FY2011 survey.
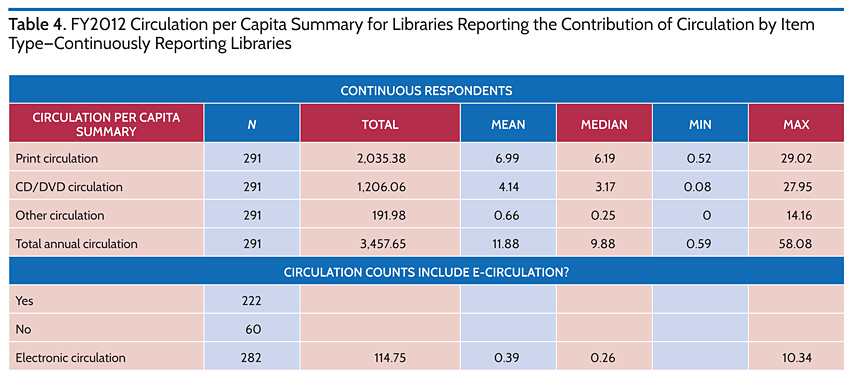 Table 5 shows electronic circulation per capita for all libraries reporting each item type and circulation activity for their library. Table 6 shows electronic circulation for all libraries that reported this activity in FY2011 and/or FY2012. In FY2012 more than twice the number of libraries reported electronic circulation contributing to a 161 percent increase in total e-circulations (0.40 e-circulations per capita).
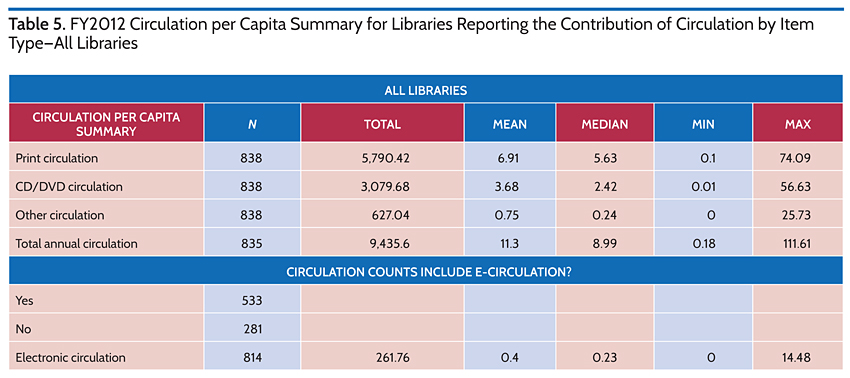
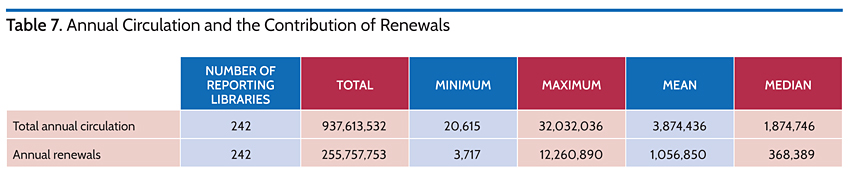
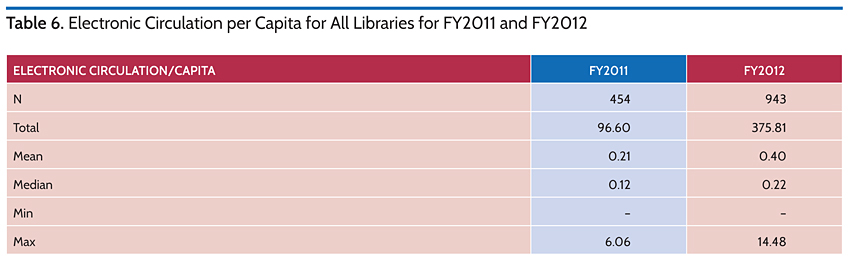 Table 7 includes circulation per capita results for 242 continuous reporting libraries that reported both total annual circulation and renewals (renewals represents 27.3 percent of total annual circulation).
 Collection turnover rates (circulation/holdings) are depicted in figure 8 (FY2012 results for all libraries and the continuous reporting libraries).
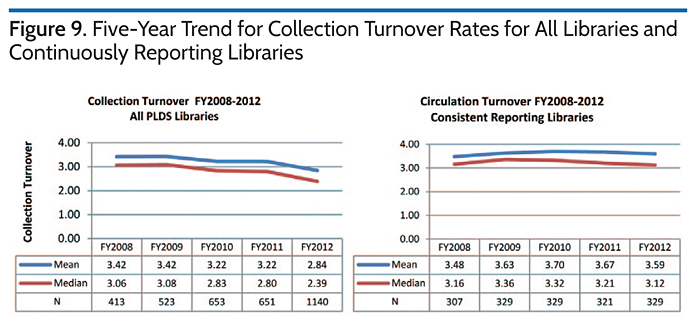
The rates calculated for each library, summarized in figure 9, show the effect of a higher number of reporting libraries giving rise to lower mean and median collection turnover rates compared to previous years. The collection turnover rate for the continuous reporting libraries shows a continuing softening over the past three years. Collection turnover rates are likely also impacted by the current transition to new formats of holdings (e-materials) and new ways to consume information (circulation) and the ways in which these are counted.
 Annual Visits
The continuous library responder group shows fewer library visits per capita (1.5 percent fewer). Table 8 shows results for continuous respondents.
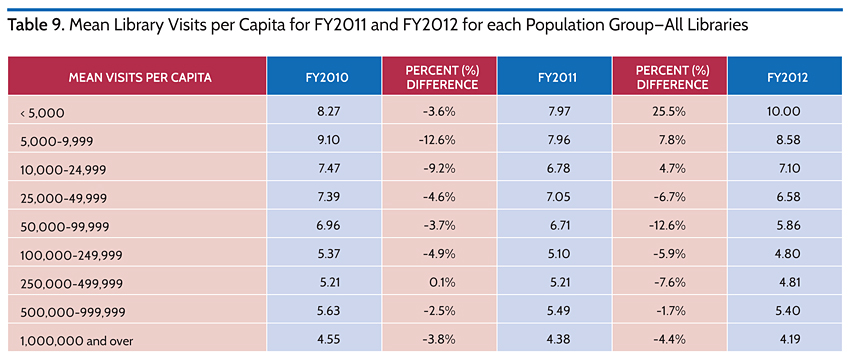
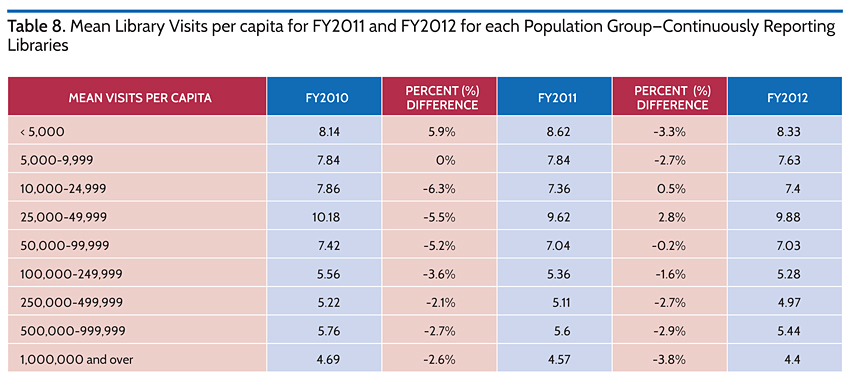 Table 9 shows results for all responding libraries. Libraries serving populations of less than 25,000 recorded more visits per capita, between 4.7 and 25.5 percent, an average of 1.6 more visits per capita than libraries serving communities of 25,000 or more. Libraries serving populations below 100,000 saw an average of at least 7.03 visits per capita very similar to the previous year.
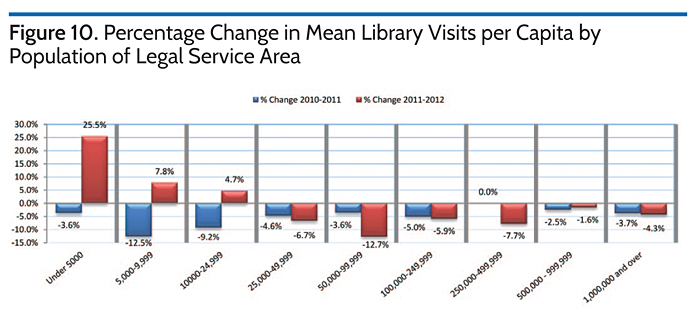
 Average library visits per capita for all reporting libraries was 7.05 (N=942) (>11 percent increase over last year). Figure 9 shows that this increase can be accounted for among smaller libraries serving populations of less than 25,000 people where more libraries in this segment contributed data this year (959 libraries reported 535,057 mean annual visits in FY2012 compared to 377 having mean annual visits of 648,273 in FY2011). Libraries serving population groups of 25,000 or more reported a decrease in average library visits per capita; a trend continuing from the previous year.
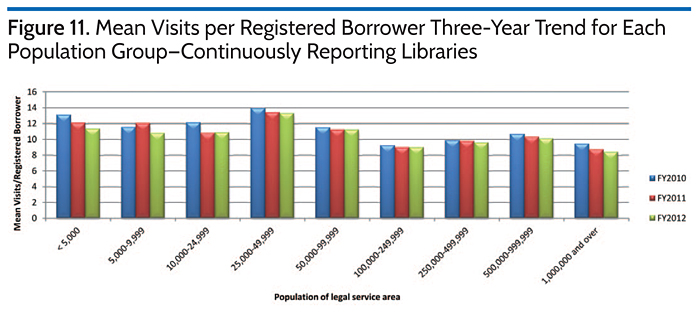
Figure 10 shows the percentage change of library visits in the past two years for each population grouping and figure 11 shows the three-year trend for the mean annual visits per registered borrower for each population grouping. This pattern of declining registrations suggests a relationship between the decreasing library visits for libraries serving populations of 25,000 or more.
 Changes in hours of operation (total hours open and convenient hours open) likely impacts the number of library visits and other in-library service usage, including circulation, program attendance, and reference questions asked/answered (where staff involvement is required). Table 10 shows the three-year trend for hours open per week by population grouping. Consistent with other observations, in four out of the nine population groups, the mean public service hours per week has reduced. This reduction in hours likely explains reductions in the numbers of library visits and other activity counts.
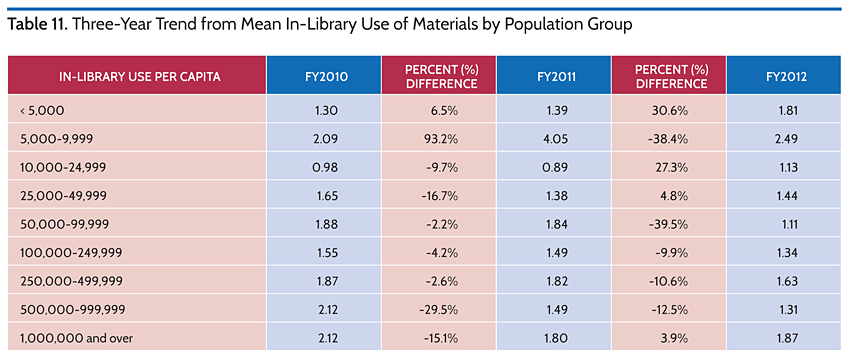
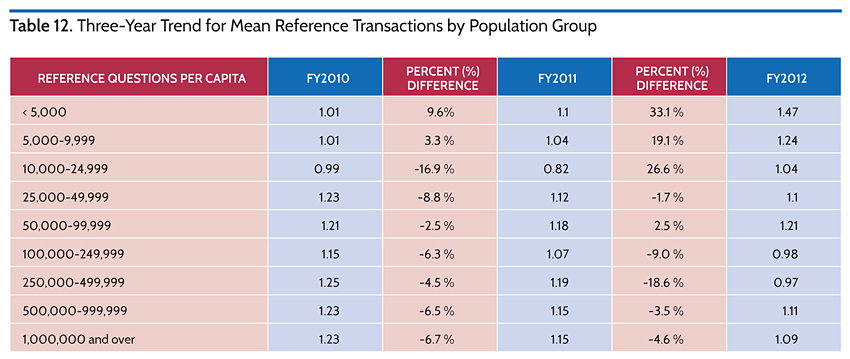
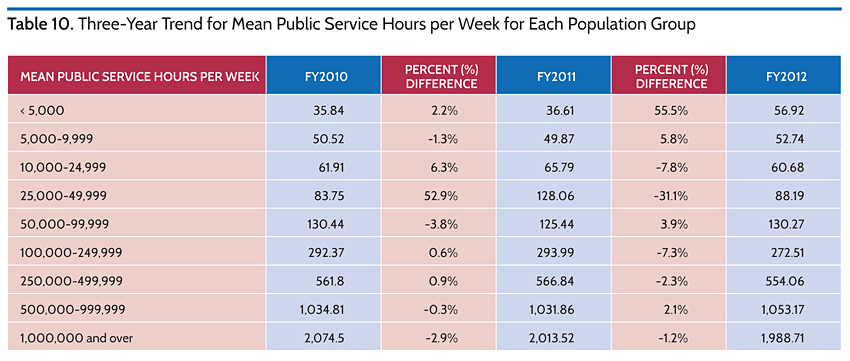 Tables 11 and 12 show the three-year mean activity counts for in-library visits and reference questions. While fewer hours of operation are not the only factor affecting visits and related service usage, the pattern is consistent for libraries in population groups showing reduced hours of operation. The mean in-library use of materials rates per capita are 6.98 percent lower (248,766 in FY2011 to 231,396 in FY2012) and mean reference transactions are 17.89 percent lower (160,261 in FY2011 to 131,587 in FY2012).
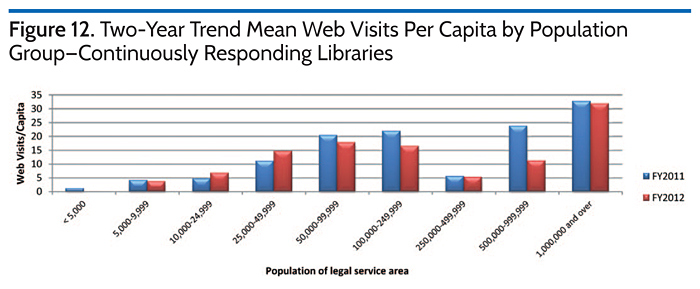
 Given the availability of remote online library services (including reference services, downloadable materials, and online databases) it might be reasonable to assume that physical visits have been displaced by remote/online visits. However, as figure 12 shows, an expected increase in web visits per capita has not occurred. Instead web visits have declined an average of 13 percent. It is difficult to ascertain the cause, but the variability of systems and methods used to count website visits is likely a factor. The count methods combined with an updated definition for how to count website visits as well as difference in systems and tools used to count this activity are likely explanations for some of the differences from the previous year.
 Operating Finances
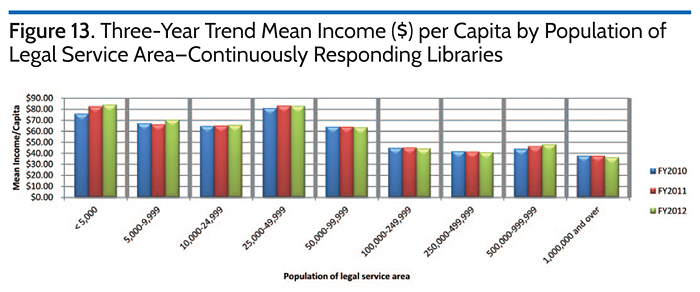
Income and expenditure measures continue to provide useful insights and therefore are a major section within the PLDS survey. For the continuous respondent group, the average overall annual library income was $14,001,457 or $53.20 per capita of the legal service area (N=351), a decrease of $0.18 from last year’s average per capita income of $53.38 (N=352).
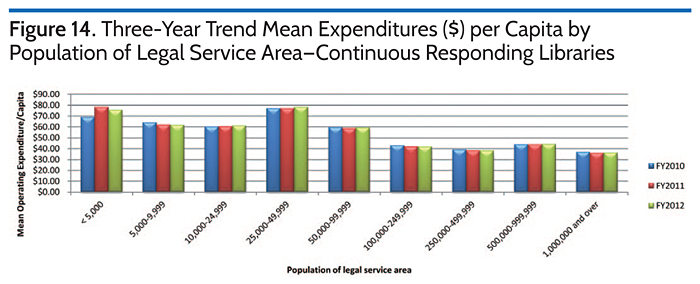
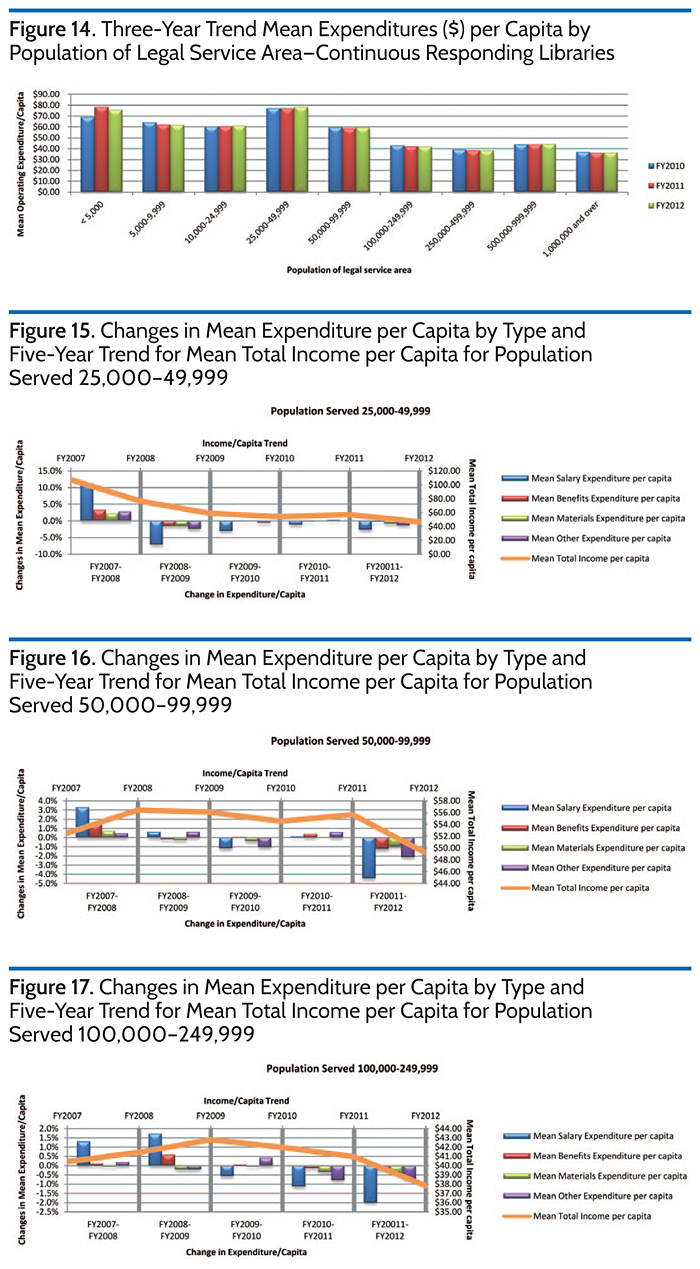
Overall annual library expenditures per capita is $49.91 (N=351). This is an increase of $0.17 per capita from the average of $49.74 (N=352) per capita in FY2011.
As shown in figures 13 and 14, the most notable patterns for the continuous responding libraries are found in the population groups serving fewer than 50,000 and those serving 50,000 and more where average income per capita and operating expenditures per capita are reported compared to the previous two years. Increases in both per capita income and expenditures were reported for the fewer than 50,000 population groups, and the 50,000 and more group reported mostly lower income and expenditures—unchanged from the previous years, although the 500,000–999,999 population group did report higher income.
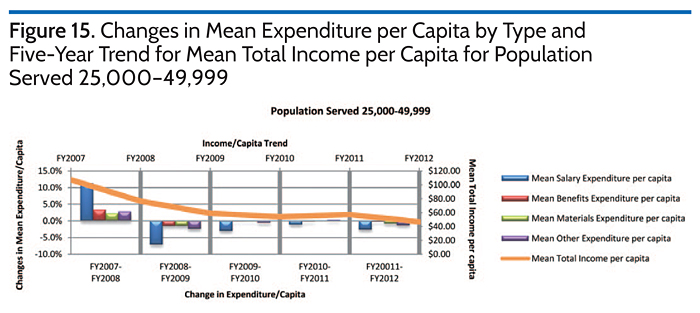
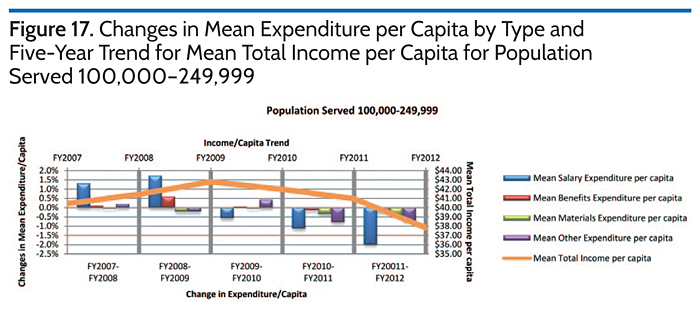
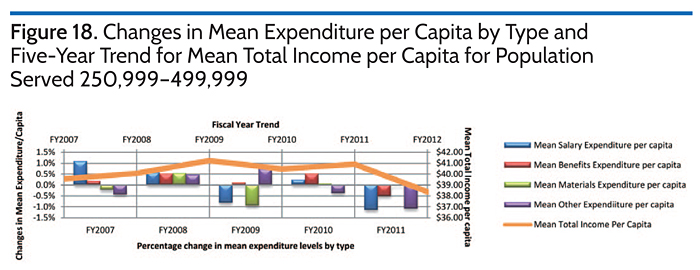
 Overall average income and expenditures per capita increased in FY2012. However libraries serving populations between 25,000 and 499,999 continue to experience reduced funding and thus continue to make cuts to expenditures per capita. Figures 15, 16, 17, and 18 depict the patterns of income and changes in the expenditures over the past five years for the medium-sized libraries. The graphics show a relationship between funding and expenditure per capita levels each year and the pattern of variability in the budget among competing categories of expenditures.
 These patterns of income and expenditure per capita are similar for all libraries and appear to depend on the sources of funding. For FY2012, all libraries serving populations of fewer than 25,000 reported increases in income from state/provincial and other sources, including the federal government. These libraries show higher income levels per capita and correspondingly higher expenditures per capita. This is most significant in the fewer than 5,000 population group.
One thing common for all libraries serving populations of fewer than 500,000 in FY2012 is that each has experienced cuts in income from local government per capita, often the most significant funding source for such libraries. The result of these cuts in spending is depicted in figures 15, 16, 17, and 18 for the population groups from 25,000–499,999.
These figures show the impact of cuts to expenditures and specifically reduced expenditure on staff. Interestingly, for the group of continuous responding libraries, the portion of total expenditures spent on staff has tended to grow (1.67 percent from 2008 to 2011, and -0.14 percent in 2012) relative to the other areas of spending and since 2007 the percentage of librarians on staff has been increasing while the percentage of non-librarians on staff has been decreasing; a reversal of the trend between 2002 and 2007 for the composition of staff.
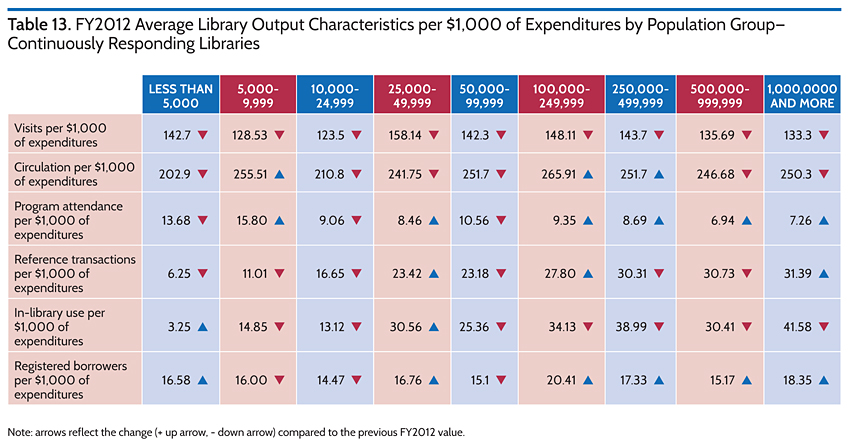
Table 13 (see page 38) summarizes various library outputs as a function of expenditures per capita in each population grouping for the continuous responding libraries (N=349). Icons depict the change in value relative to previous year values. In FY2012 per $1,000 spent, continuous reporting libraries realized on average per $1,000 spent:
- 1.63 percent fewer visits
- 1.41 percent fewer circulations
- 3.36 percent more program attendees
- 6.25 percent fewer reference transactions
- 22.63 percent fewer in-library uses
- 4.36 percent more registered borrowers
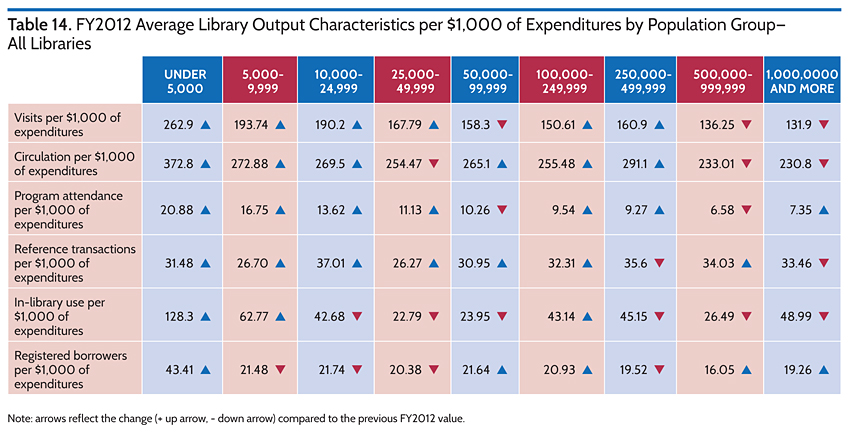
Table 14 on page 38 (also reported last year) represents the overall use of funds by the libraries (activity per expenditure). As compared with results published last year, most figures have increased. Each of the population groups show similar relative changes in activities and expenditures. For example, the population groups between 50,000 and 499,999 overall incurred lower expenditures per capita (-8.56 percent) between FY2011 and FY2012 and had fewer registered borrowers (-0.29 percent) and library visits (-7.47 percent) per capita and simultaneously recorded fewer activity counts. Overall the measures show more up arrows (34) than down arrows (19). This suggest that the respondent libraries in general in FY2012 were accomplishing more with fewer dollars (or more with more dollars) and the implication being
that activity levels are proportionately higher than the operational expenditures that support these activities.
 Technology
Use and availability of technology in libraries is an important part of the PLDS survey. This set of questions was unchangedfrom the previous year and provides useful comparative results, listed in descending ranked order according to the percentage of libraries that confirmed they provide the technology service.
Technology equipment available in libraries showed an increase in each category except automated systems. Tablets (127 percent), Video game consoles (60 percent), e-book readers (55 percent), other equipment (e.g., wattage readers) (15 percent), and laptops (10 percent) posted the largest increases in the percentage of libraries confirming they offer these technologies compared to last year’s results.
Among the many website offerings, library apps for mobile devices (32 percent) showed the largest increase and user-driven content (10 percent) and streaming live programs made modest increases in the percentage of libraries confirming they offer these services.
Meanwhile, in terms of responding libraries, a smaller percentage (12 percent) indicated they offer Wi-Fi inside. Statistics concerning Wi-Fi outside, tracking of subscription databases, and access to local digitized content were unchanged in proportion of libraries offering these services.
Special Section: Facilities Survey
A report summarizing results from the Facilities Survey questions included in the PLDS 2013 special section is posted online at www.plametrics.org. If you would like to be notified of additional information about these results and future surveys, please contact pla@countingopinions.com or fill out the notification form on the PLAmetrics website.
2014 PLDS Survey
Results of the 2014 PLDS survey (FY2013 results) will be available soon. For more information, please visit the PLAmetrics website or send an email inquiry to pla@countingopinions.com. The PLDS survey continues to capture timely and relevant data about public library trends. PLA encourages libraries to use this data to enhance their decision-making and advocacy efforts. We also encourage your comments and feedback. And once again, thank you to all of the responding libraries who took the time to participate.
Tags: library data, library databases, library statistics, PLDS