The 2014 Public Library Data Service Statistical Report: Characteristics & Trends

The Public Library Data Service (PLDS) is an annual survey conducted by PLA. This 2014 survey of public libraries from the United States and Canada collected fiscal year (FY) 2013 information on finances, resources, service usage, and technology. Each year PLDS includes a special survey highlighting one service area or public library topic. In the 2014 survey, the supplemental questions focused on performance measures.
PLA continues its relationship with Counting Opinions (SQUIRE) Ltd. to provide the service for capturing the data and for the online PLAmetrics subscription service offering access to the longitudinal PLDS data sets going back to FY2002 and data from the Institute of Museums and Library Services (IMLS) going back to FY2000. PLAmetrics provides public libraries real-time access to meaningful and relevant public library data for comparing and assessing their operations using a variety of custom report formats and customizable report templates.
This report presents selected metrics for FY2014 PLDS data and previous year results in tables and charts with related observations. The results in this report were compiled using PLAmetrics.
Research Method and Context
Participation in the PLDS is voluntary and participants have the option of providing responses to any or all of the questions that comprise the survey. Similar to previous years, public libraries in the United States and Canada were invited to participate in the survey. Emails (2,841) were sent to launch the survey (February). All PLA members were notified of the survey launch via email, social media, and webpage posts; postcards were handed out and the survey was promoted during a PLAmetrics session (at PLA 2014 in Indianapolis); follow-up letters and emails were sent throughout March and April and the deadline for submission was extended to May 13th. State data coordinators from the United States and Provincial/association coordinators in Canada were contacted about promoting the survey to their libraries. Their involvement again led to increased awareness and participation. 2,454 of American and Canadian public libraries partially or fully responded to the request for data—a response rate of 26 percent (a 23 percent increase over last year); however, due to the voluntary nature of this survey, several libraries had to be contacted for additional data resulting in 1,800 libraries included in the final data analysis. This is a decrease from last year’s number of 1,897, but still higher than previous years of 1,579 and 1,461.
Please refer to the PLDS Survey website for copies of the survey and definitions of questions.
Overall Summary
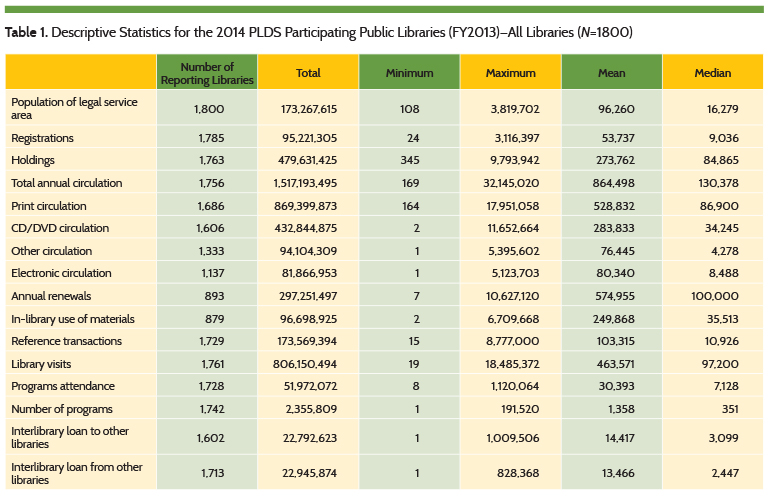
Similar to previous years, table 1 depicts summary data representing all libraries that provided non-zero values for the selected
measures. Though the number of reporting libraries increased the mean, reported values all decreased (exception number of programs with a modest 0.7% increase) compared to FY2012 results, indicating that the increased response rate includes smaller libraries. Consistent with previous years, we also include analysis of the continuously responding libraries and comparison of results within each population grouping.
 PLAmetrics includes data from FY2002. Figure 1 shows the cumulative percentage change in mean per capita values reported by the continuously responding libraries (N=230) over the past 11 years since FY2003. Some traditional input/output measures (Circulation, Library Visits) peaked in FY2009.
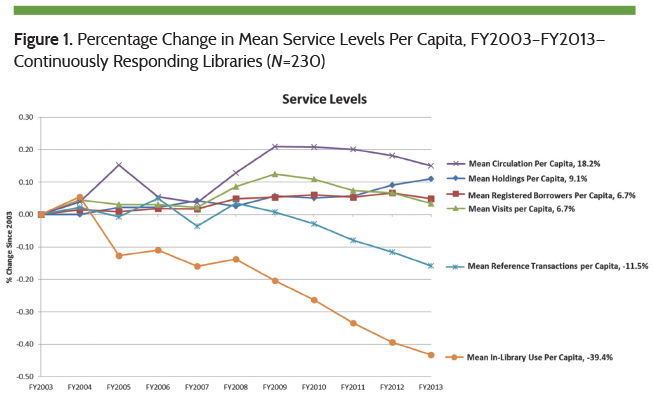 Between FY2008 and FY2009 the United States and Canada were in full recession. Since 2009, other than Holdings and Registrations, each of these measures has declined with Reference Transactions and In-Library Use showing more significant decreases.
Holdings per capita grew at an overall rate of 1.1% per year since FY2003. The rate of growth in holdings in the past 3 years (FY2011 to FY2013) was 2.5% per year, which is more than 3.5 times the rate of growth (0.7% per year) between FY2003 and F2011. This rate of growth can be attributed to the addition of electronic materials (see figure 10) while populations have increased at a slower rate (see figure 17 for population information).
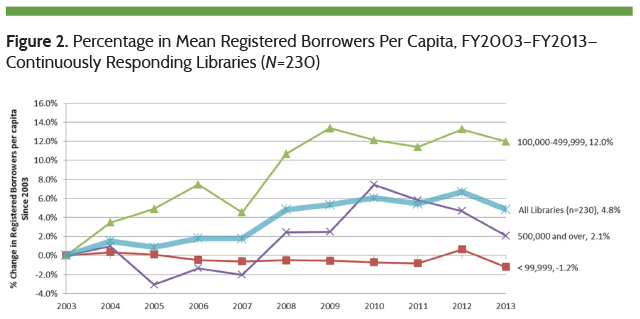
Registered borrowers per capita for the group of continuously responding libraries (N=230) has grown by 4.8% since FY2003 as shown in figure 2. The fastest growth occurred between FY2007 and FY2010 and has declined across all libraries in the past year—more than ever before.
 Coincident with these changes has been the growth in the use of mobile phones and mobile browsing.
According to a September 2013 Pew Research Center article, “Six in ten cell phone owners (63%) now go online using their mobile phones, an eight-point increase from the 55% of cell owners who did so at a similar point in 2012 and a two-fold increase over the 31% who did so in 2009.”1
Newer devices, such as tablets, e-readers, and netbooks that are more affordable and, for many, easier and more intuitive to use have also emerged in the market. Technology has put the library (its website) and other information sources more readily at hand and given library users an alternative to visiting the library or using the reference services of the library.
Operating Finances
Since the recession, mean library income has flattened reflecting a tightening of available funding and a corresponding reduction in spending. Figure 3 shows the year-over-year percentage increase in mean income since FY2003 with related percentage changes in mean Expenditures for the continuously responding libraries. Between FY2003 and 2009, mean library income per capita increased by 25.4% but in the last 5 years (FY2009–2013) mean income per capita decreased by 1.01%. For these same periods, mean expenditures per capita increased by 25.23% (FY2003–2009) and decreased by 1.14% (FY2009–2013).
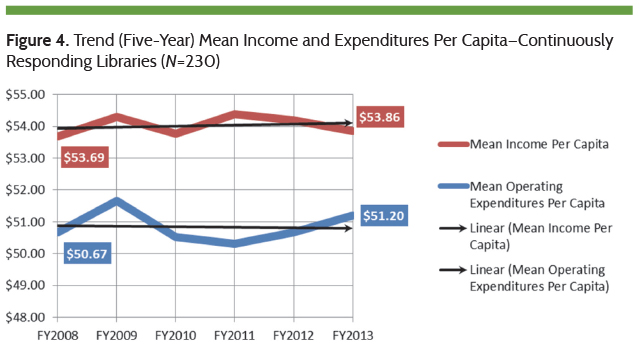
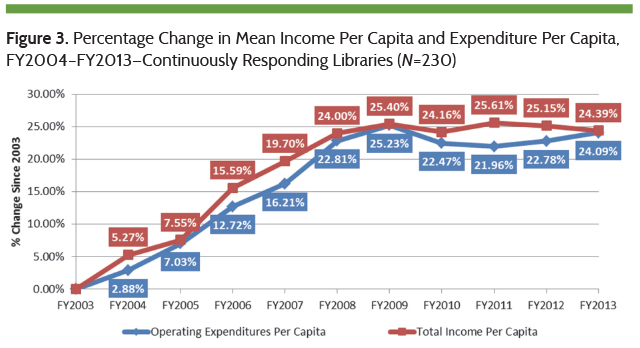 Figure 4 includes the five-year trend for mean income and expenditures per capita for the continuously responding libraries. The margin between income and expenditures narrowed in FY2013 resulting in an overall mean budget surplus of $2.66 per capita compared to a budget surplus of $3.02 per capita in FY2008.
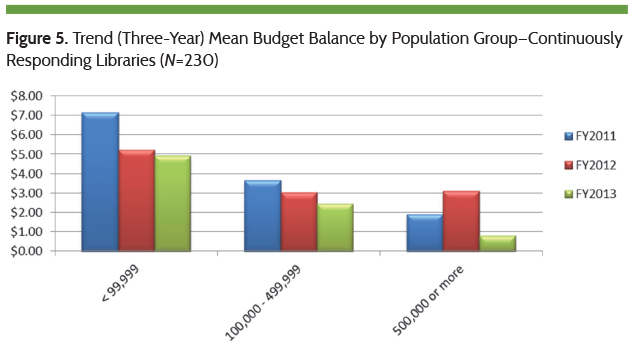
 Budget surpluses were maintained by all population groups in FY2013, although these diminished compared to the previous 2 years (FY2011 and FY2012). Those libraries serving a population of legal service area (Pop LSA) more than 500,000 reported income per capita ($42.87) and expenditures per capita ($43.65) resulting in a narrow per capita budget balance surplus ($0.78) as depicted in figure 5.
 With income per capita plateauing since 2008, libraries have been unable to increase their spending without running thinner budget surpluses. Budgeting allocations are shifting—for example, increased purchases of e-materials, increases in staff expenditures (see figure 6)—and necessitating a shift of spending in other areas of the library and emphasis perhaps in seeking new funding sources (for example, donations, grants, and so on).
 Operating Expenditures
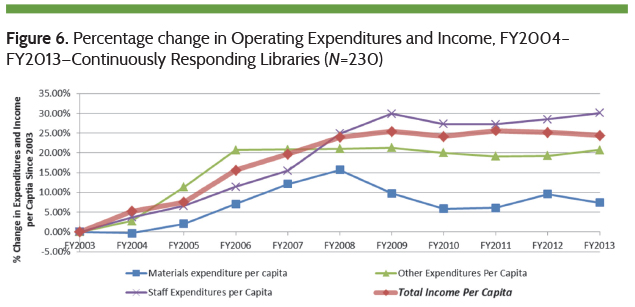
Figure 6 shows the cumulative percentage change in Expenditures per capita by type, with reference to the percentage change in income per capita for the continuously responding libraries (N=230). It is notable that staff expenditures per capita (+0.17%) have increased more than any other area since 2009. Materials expenditures per capita (-2.15%) and other expenditures per capita (-0.47%) have decreased.
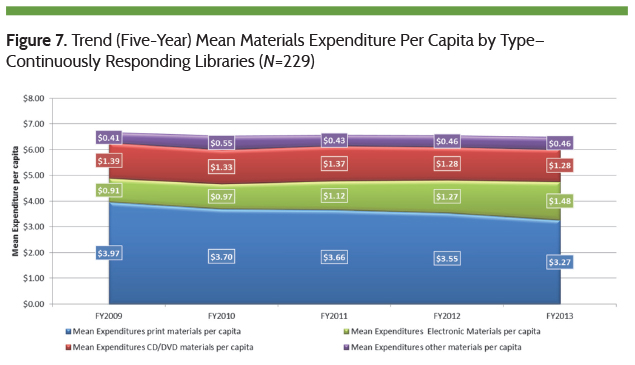
Figure 7 shows continuously responding libraries (N=229), that reported some combination of print, electronic, CD/DVD and other expenditures. In addition, figure 7 shows overall materials expenditure per capita modestly declining (-0.72% per year) since FY2009. The most significant components of change are attributed to the increase in e-materials spending (63%) and Other Materials spending (12%) with reductions in print materials spending (-18%) and CD/DVD spending (-8%) since 2009.
 Circulation
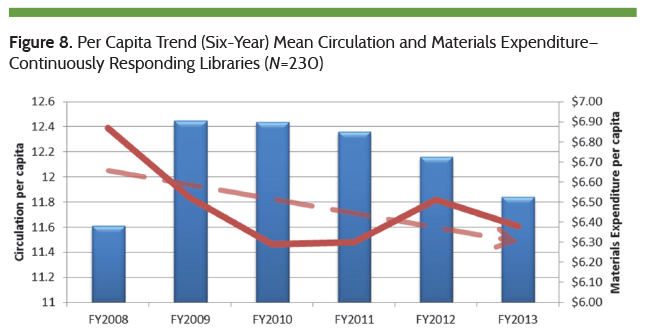
In the 6 years between 2003 and 2009, mean circulation per capita increased at a rate of 3.23% per year and is declining at a rate of -1.25% per year ever since (N=230). Figure 8 shows the levels of mean circulation per capita since 2008 and the changes in mean materials expenditures over the same period. Since peaking in FY2010, mean circulation per capita has decreased an average of 150 circulations per 1000 persons per year.
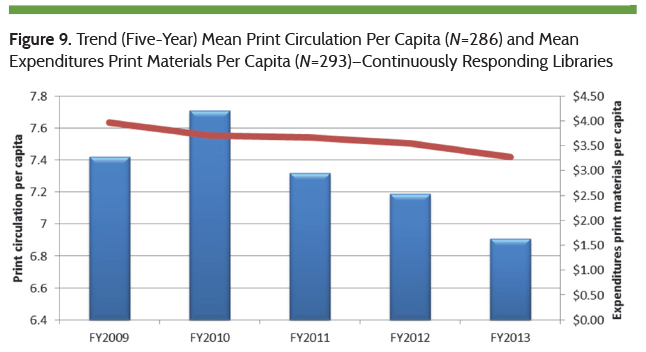
 A contraction in materials expenditure and changes in the mix of materials purchased may be impacting changes in material circulation. Figure 9 shows a decrease (-17.6%) in print materials spending and a decrease (-6.9%) in print materials circulation since FY2009. Print materials circulation and spending appear to be strongly related at a ratio of approximately 2.5:1. This suggests that should spending on print materials continue to decrease at the rate of ~5% per year, then print circulation could likely continue to decrease at a rate of ~2% per year.
 Conversely, figure 10 shows mean electronic materials spending per capita and mean electronic circulation per capita (since this metric began being captured in FY2011) increasing at a rate of 12.9% per year and 66.8% per year respectively. But, despite these rates of growth for electronic materials, overall circulation has still declined for the continuously responding libraries.
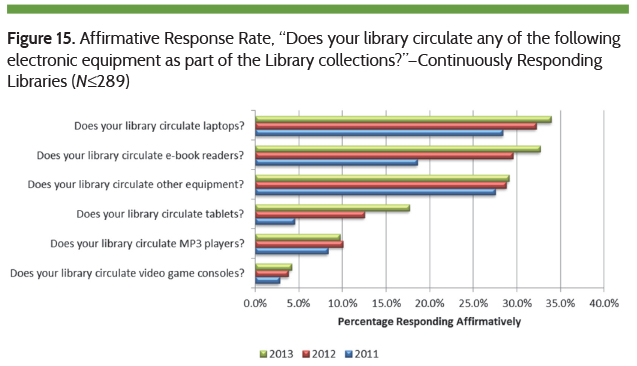
Mean other materials circulation per capita has grown 8.06% per year since 2008. Other circulation includes laptops, e-book readers, tablets, MP3 players, game consoles, and other equipment that more libraries have declared they circulate in the past 3 years (see figure 15). Conversely mean CD/DVD circulation/capita declined 0.59% per year and spending on CD/DVD materials/capita decreased at a rate of 1.3% per year since 2009. These declines are not unexpected since CD/DVD materials are being gradually phased out in favor of downloadable formats.
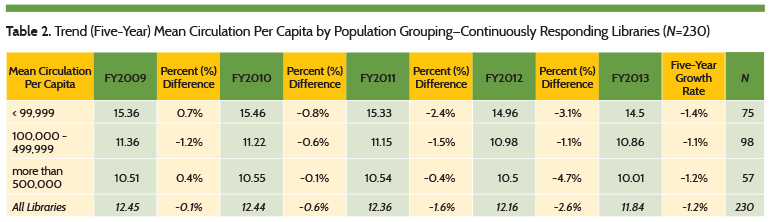
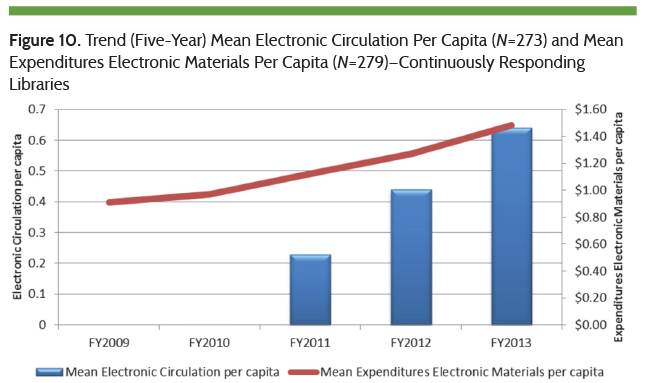 Table 2 shows that circulation per capita has declined for all population groups at a rate greater than 1% per year over the past 5 years.
 Holdings
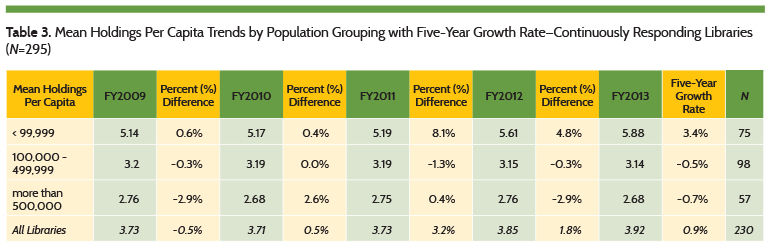
Mean holdings per capita has increased from 3.51 (FY2003) to 5.35 (FY2013) for the continuous reporting libraries; a growth rate of 4.3%/year since 2003 (3.0%/year between 2003 and 2009 and 6.3%/year between 2009 and 2013). Table 3 shows libraries serving populations under 100,000 have increased their holdings in the past 5 years, while libraries serving populations over 500,000 have trimmed their holdings. Some exceptional increases in holdings were reported by the smaller libraries (serving populations under 5,000). One impact on these results may relate to how electronic materials are counted.
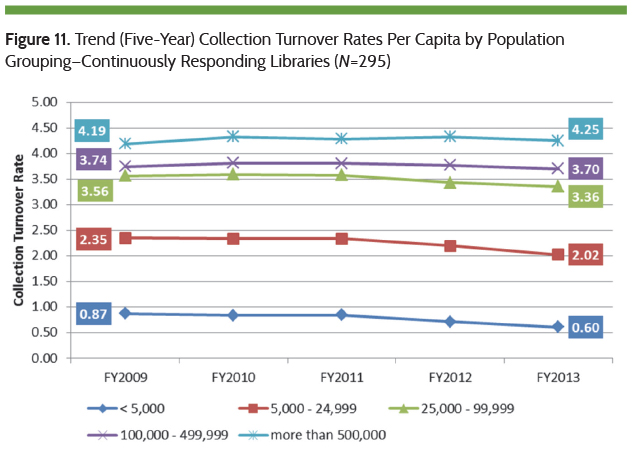
Figure 11 shows Collection Turnover Rates per capita for each population group. As a result of greater increases in holdings relative to circulation, over the past 5 years libraries serving populations under 100,000 have lower collection turnover rates decreasing at a rate between -1.5% and -8.6% per year. Libraries serving populations greater than 100,000, however, decreased their holdings per capita relatively faster than the decrease in circulation per capita. Collection turnover per capita rates have declined by 0.3% per year for libraries serving 100,000 to 499,999, and 0.4% per year for libraries serving more than 500,000 persons.
 Staff
Staff
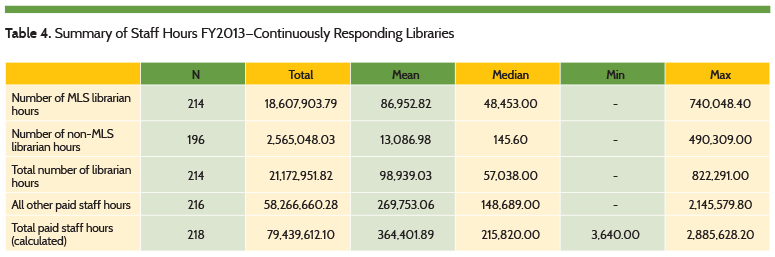
In FY2013 a new methodology and definition was implemented for capturing staff personnel counts. Previously, personnel head counts were reported as full-time equivalent (FTE) funded positions based on a standard work week of between 35 and 40 hours—whether the position was filled or not. The reporting requirement changed to ask for total actual hours worked per year for all staff persons paid by the library budget, including paid leave and vacation. This change was to normalize staffing figures provided by the libraries, improve the metric in terms of comparability and accuracy, and provide a measure of staff availability.
This change resulted in some challenges. Questions about this change required the most support throughout the survey with several respondents requiring clarification of the requirement. Based on the questions received, the wording of the definition was improved. Analysis and follow-up regarding outlier responses was undertaken. Hours worked were converted into FTE positions by dividing hours worked by the library’s defined standard work week (for example, 37.5 or 40 hours per week). These values were compared to previous years and other available data sets. Where necessary the libraries themselves were contacted to provide clarification or to update their response.
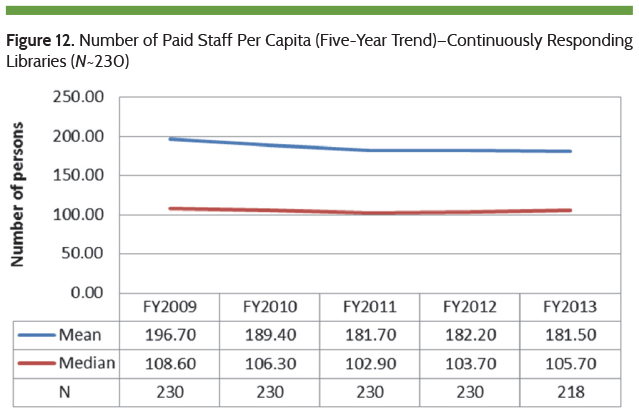
For the continuously responding libraries (N~218), table 4 summarizes the staff hours by type with totals for number of librarian hours and all paid staff.
 The values in table 4 are automatically converted in PLAmetrics to Numbers of Paid staff by type, totals, and key ratios. The following is based on these conversions and comparable data from previous years.
Figure 12 shows the mean number of paid staff has declined for the continuously responding libraries (N~230) from 196.7 to 181.5 staff persons. Figure 13 shows that during the same time, the percentage of FTE librarians increased while the percentage of other qualified staff FTEs have declined.
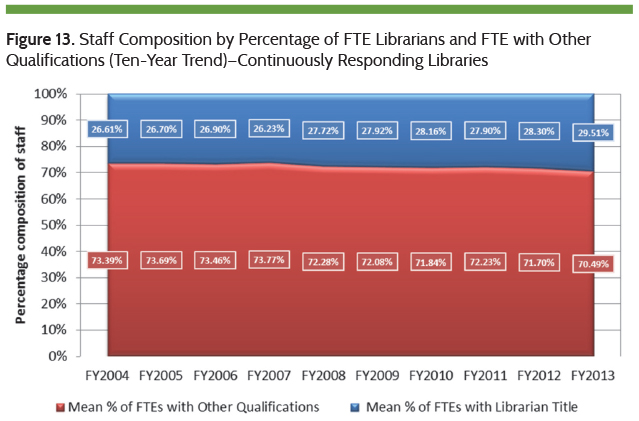 Between FY2009 and FY2013 mean salary expenditures per capita declined from a peak of $26.45 per capita to $25.44 in FY2011 and since has increased to an average of $25.77 per capita for the continuously responding libraries (N=230) (see figure 14). With flat growth in library income since 2009, and a corresponding reduction in overall spending on staff between FY2009 and FY2010, each component of staff shrank somewhat in 2010. However, since then, the percentage of non-MLS librarian FTEs has increased (9.9% annual growth) while the percentage of MLS librarians has decreased (-1.4% per year). Since 2010 mean other staff per capita decreased at a rate of -0.4% annually despite a 2.8% increase between FY2012 and FY2013.
 Technology
In the past three years, more libraries (continuously responding libraries) declared that they offer a growing variety of tech equipment. Figure 15 shows a significant increase in the percentage of libraries that circulate tablets—an average 98% increase in each of the last 2 years. Several libraries also declared that they offer e-book readers (33% more since FY2011), while laptops and MP3 players were offered by an average of 9% and 8% more libraries respectively in each of the past two years, although MP3 players were offered by 0.3% fewer libraries in FY2013.
 Marshall Breeding has recommended that “It is important for libraries to keep a close eye on the technology trends in the broader consumer arena. We in libraries need to be tuned into the technology habits of each slice of the demographics that use our services and do as much as possible to anticipate the next wave.”2 It is good to observe increases in the provision and circulation of technology devices listed in figure 14, including other equipment (for example, digital cameras, video recorders, projectors, wattage meters, leap pads, and so on), however fewer than 35% of the continuously responding libraries offer such electronic devices for circulation. As discussed earlier, it is possible that costs and/or additional spending are prohibitive due to the tightness of budgets and the myriad of competing expenditures. The reality of the last five years is likely holding more libraries back from offering a wider amount and variety of electronic equipment, combined with the challenges inherent with understanding, acquiring, and offering such emerging technologies.
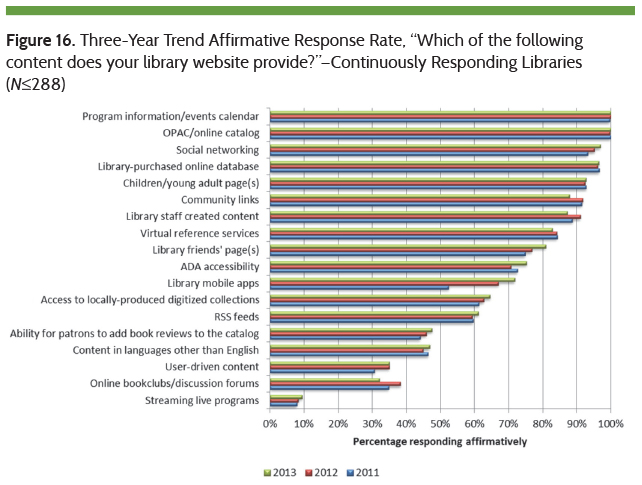
In the same article, Breeding writes “libraries have been working to incorporate elements of social networking into their services and to better support mobile devices. In these areas, it seems as if libraries have been a bit slow on the uptake. Many library products now include some social features, and many patron-oriented products now have versions for mobile devices.”3 Figure 16 shows that as of FY2013, 97% of continuously responding libraries (N=288) offer social networking, compared to 88% (N=1027) of all responding libraries. By FY2015 program and events calendars, the OPAC and social networking will likely be offered by all continuously responding libraries if current growth rates of 1.7% per year continue. It is interesting that online book clubs/discussion forums were offered by fewer libraries (-6.2%) in FY2013.
 The number of libraries offering mobile applications has grown by 17% over the past two years among the continuously responding libraries. This growth has been most significant among the library web-based offerings, but slowed to 7.1% in FY2013. According to Pew Research, “As of January 2014, 90% of American adults have a cell phone. 58% have a smartphone.”4 Mobile usage and mobile apps are an area of library technologies that bears continued attention by the library community to enable real-time, anywhere access to information and services purveyed by libraries.
It is notable that community links, library staff–created content, virtual references services, and online bookclubs/discussion forums show fewer libraries affirming that they offer these. The combination of these offerings and others differentiate the library from similar alternate sources yet it seems a softening has occurred in these areas of service. Evidence is inconclusive in this area, but it is coincidental that website visits per capita for the continuously responding libraries (N=262) has declined 18.4% per year since 2012 from 17.65 to 11.76 website visits per capita in FY2013. As a metric of success this trend suggests a diminishing affinity for the content and services provided by the library website despite increased means to access these resources anywhere and anytime; and/or suggests that greater competition from other similar services and resources is drawing traffic away from library websites. Perhaps pathfinders like the Edge Initiative can help to direct and focus strategic efforts of more libraries to improve and attain continuous growth and development of their technology services offered to the public.
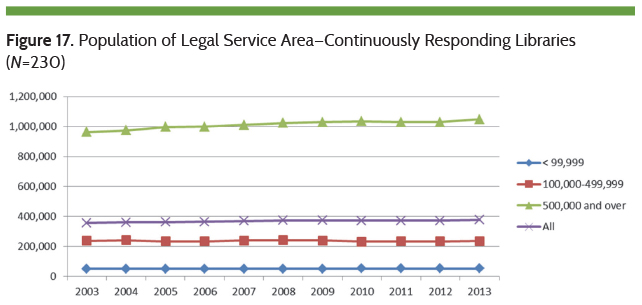
Population
The foregoing discussion is largely based on per capita ratios. Since the population of legal service area is not static, figure 17 shows the mean population of legal service area (PopN LSA) grouped by various population groupings. From FY2003 to FY2013 PopN LSA grew annually: 0.38% for the group <99,000; -0.14% for the group 100,000 to 499,999; 0.86% for the group 500,000 and over; and, 0.56% for All Libraries (N=230).
Performance Measures Survey—Outcome Measurement
As part of the 2014 PLDS survey, the PLA Performance Measurement Task Force (PMTF) introduced the special section on performance measures to learn about the awareness, importance, and readiness of public libraries in measuring program outcomes. Outcome measurement answers the question, “What difference did the program make to the user?” IMLS defines outcomes as “benefits to people: specifically, achievements or changes in skill, knowledge, attitude, behavior, condition, or life status for program participants (‘visitors will know what architecture contributes to their environments,’ ‘participant literacy will improve’).”5
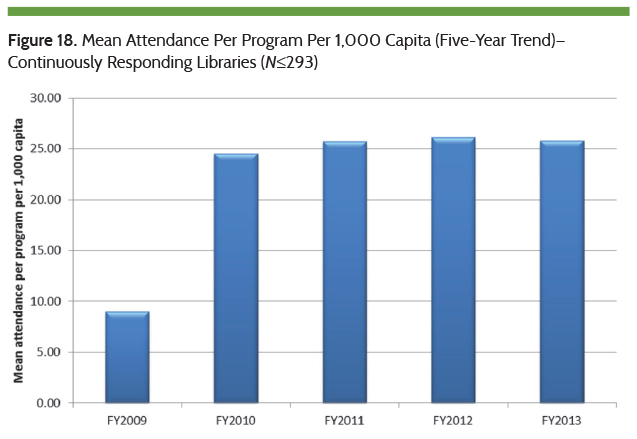
Figure 18 shows the mean ratio of program attendees to programs per 1000 capita since FY2009 for the continuously responding libraries (N≤293). In the past 5 years this ratio has increased by 23.6%/year. However, between FY2009 and FY2010 the average number of programs per 1000 capita decreased by more than 50% resulting in the higher ratio of attendees to programs. Since FY2010 this ratio has increased at a rate of 0.94%/year.
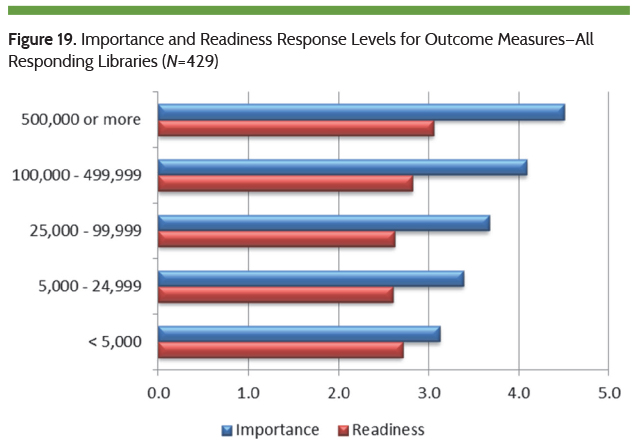
 Altogether, 430 libraries responded to the PLA Performance Measures Survey (Special Section), indicating that outcome measurement is Important (3.6 out of 5) and are Somewhat Ready (2.7 out of 5) to measure outcomes. Figure 19 shows the importance and readiness response levels (scale low (1) to high (5)) for each of the population groupings. Note, despite a slightly higher readiness score for the <5,000 population groups, the importance and readiness scores correspondingly increase with the size of PopLSA group. This is more apparent for importance scores where larger libraries serving populations of 100,000 or more responded that outcome measures are important to very important; and smaller libraries serving populations less than 100,000 responded that outcome measures are somewhat important to important. Only the libraries (PopLSA > 500,000) indicate being ready to capture/measure outcomes, and all other libraries in the other population groups responded that they are somewhat ready.
 The capture of outcome measures is more challenging and requires the library to ask users (program participants) to declare the benefits they have realized from their library use and/or participation and/or find/track other sources of information relating to demonstrations of outcomes, such as improved grades, reading levels, increased participation rates, higher income, employment, and so on. It is not surprising that most libraries are only somewhat ready to capture and track outcome measures.
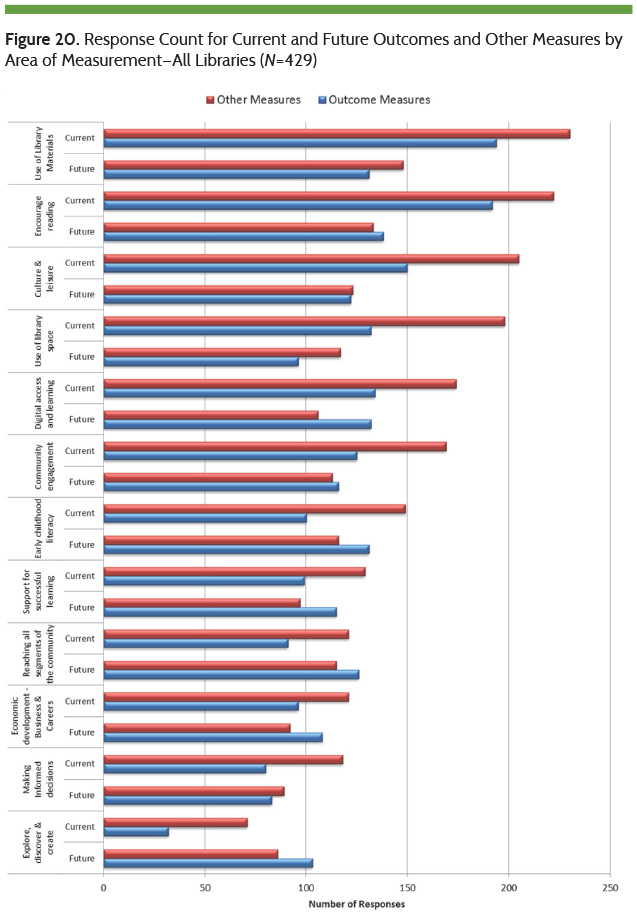
Figure 20 is a ranking of libraries that currently track other measures (Yes) by the twelve areas of measurement presented. Included are the number of libraries that currently measure outcomes and plan to track outcomes or other metrics. This chart essentially provides a glimpse of plans for evidence-based demonstration and defence of the value and benefit of the libraries.
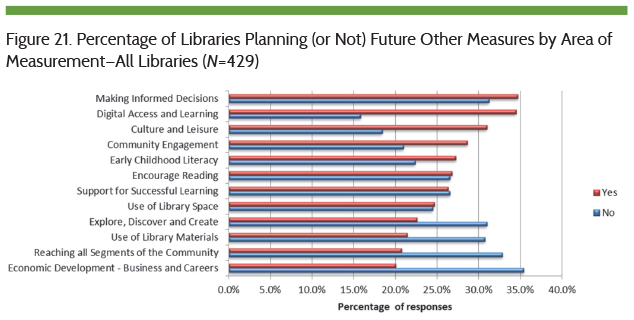
Figure 21, shows the percentage of libraries planning to capture other (input/output) measures (Yes) in the twelve areas of measurement versus the percentage of libraries that do not plan to capture (No) these same measures in the future. Based on percentage of responses, the planned areas of other measures rank quite differently compared to the current other measures ranked in figure 20.
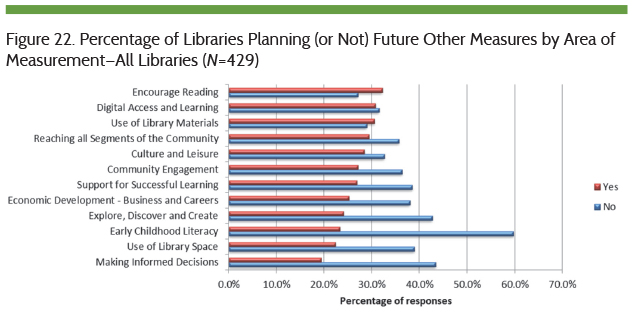
 Similarly for planned outcome measures, figure 22 shows the percentage of libraries planning to capture outcome measures (Yes) in the twelve areas of measurement versus the percentage of libraries that do not plan to capture (No) these same measures in the future.
 Priorities show a different ranking of the areas of outcome measurement compared to library plans above. In table 5, early childhood literacy is the top priority, whereas in the future it is closer to the bottom. Perhaps this difference suggests a perceived degree of difficulty associated with the capture of some outcomes. While outcomes related to early childhood literacy are considered important, planning to capture these outcomes may represent a bigger challenge. For example, young children and/or infants cannot declare the benefits they have received through library use and participation; instead parents/caregivers may have to provide observations about outcomes (for example, increased levels of interest and/or enjoyment of reading).
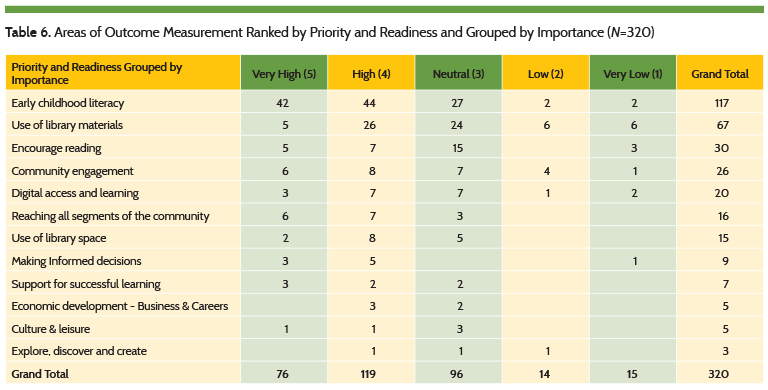
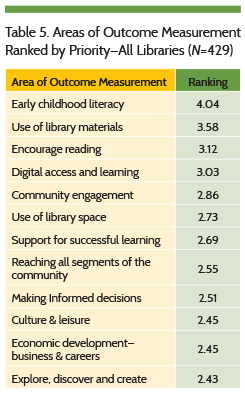 Table 6 shows the ranking of the outcome measurements by priority and readiness and cross-tabulated with importance. This ranking is very similar to the ranking by priority. Readiness responses and importance of outcomes at the library do not change the rankings much. For example, community engagement moved from fifth place by priority to fourth place ranked by priority and readiness and importance, a swap with digital access learning. Reaching all segments of the community, for example moved up 2 spots to sixth from eight above. Support for successful learning dropped from seventh by priority to ninth.
 2015 PLDS Survey
The 2015 PLDS survey (FY2014 results) runs from January to April 30, 2015. To participate, please visit the PLDS survey website or send an email to pla@countingopinions.com for more information. The PLDS continues to capture timely and relevant data about public library trends and offers online access to this data through PLAmetrics. PLA encourages libraries to use this data to enhance their decision-making and advocacyefforts. We also encourage your comments and feedback. And once again, thank you to all of the responding libraries who took the time to participate.
References
- Pew Research Center, “Main Findings: Cell Internet Use 2013,” Sept. 16, 2013, accessed Jan. 14, 2015.
- Marshall Breeding, “The Systems Librarian: Library Technology Forecast for 2014 and Beyond,” Computers in Libraries 33, no. 10 (Dec. 2013), accessed Mar. 25, 2015.
- Ibid.
- Pew Research Center, “Cell Phone and Smartphone Ownership Demographics,” Dec. 17, 2013, accessed Jan. 14, 2015.
- Institute of Museum and Library Services, “Basics,” accessed Jan. 14, 2015.
Tags: PLDS, plds statistical report