It’s International Love Data Week 2024

February 12-16, 2024, marks the annual international celebration of Love Data Week! This year’s theme is “My Kind of Data.” Data is personal – even for public libraries. The Public Library Association (PLA) has tools and learning opportunities for maximizing your library’s data to create “a kinder world through data.”
Project Outcome
 Project Outcome is a free online toolkit designed to help libraries understand and share the impact of essential library programs and services by providing simple surveys and an easy-to-use process for measuring and analyzing outcomes. Project Outcome’s standardized surveys allow libraries to aggregate their outcome data and analyze trends by topic and program type. Public libraries can see how the outcomes of their programs and services compare across library branches, their state, and the nation.
Since its launch in 2015, PLA has continued to support the development and adoption of Project Outcome. New features include the ability to save and share visualizations from the data dashboards, add custom content to reports, and tag surveys with Sustainable Development Goals to track your library’s results by goal. Read recent case studies to learn how libraries have used outcome measurement to evaluate grab-and-go kits, small business programs, and partnerships for family engagement (login required).
Free Project Outcome 101 webinars are presented biannually and are accessible on-demand via the Project Outcome site. The toolkit contains a wide variety of tutorials and resources to help you learn more about using the toolkit and applying your results. To start measuring the impact of your library, register for Project Outcome for free today!
Interested in more tailored training for your library, consortium, or state? We can bring Project Outcome training to you, in person or virtually. Learn more about hosting training in this resource and contact us at info@projectoutcome.org.
 Benchmark: Library Metrics and Trends
Benchmark was created to support data-driven planning and advocacy in public libraries. With data from multiple sources all in one place, you can find the evidence you need to tell your library’s story. Benchmark provides data visualizations and interactive reporting tools that your library can use to improve performance, demonstrate value, and increase impact in your community.
All public libraries have free access to complete annual PLA surveys, view past survey responses, access resources, and see some key metrics. With a Benchmark subscription, libraries get upgraded access to:
- Interactive data dashboards with more than 100 unique visualizations that pull together data from multiple data sources including PLA’s annual surveys, the IMLS Public Libraries Survey, and the Census Bureau’s American Community Survey;
- Build custom reports from current and historical survey data; and
- Create custom peer groups for tailored peer comparisons.
The data dashboards and peer comparison tools are robust, interactive, and user-friendly. Interactive features include filters, tooltips, and the ability to view as a table or export the data from any visualization.
Ready for this next step? Watch the tutorial videos to learn more about how you can make the most of the data in Benchmark at your library. Contact plabenchmark@ala.org for additional information.
Results from PLA Annual Surveys
In 2020 PLA adopted a new model for annual surveys of public libraries, with three rotating topics. Each year the survey is administered in the fall and results are published the following summer. The results provide actionable data for public library staff and library stakeholders such as policymakers, funders, and the media. Read the free reports on the PLA website and subscribe to Benchmark for access to the full interactive dataset.
2021 Public Library Staff and Diversity Report
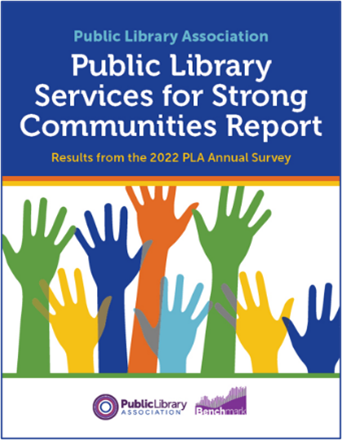
2022 Public Library Services for Strong Communities Survey Report
2023 Public Library Technology Survey Report – coming summer 2024!
Continuing Education
Attending the PLA 2024 Conference in April in Columbus? Here are a few of the programs being offered to learn from your peers about how they are using data to shape the future of their libraries.
Beyond the Numbers: Building a Culture of Data-Informed Decision-Making
Wednesday, April 3 10:15 AM ET
Learn how Columbus Metropolitan Library has created a culture that values data and evidence-based decision-making. This session will explore strategies for cultivating staff buy-in and engagement with data, as well as methods to foster a culture of continuous improvement. Speakers will share practical tips, tools, and lessons learned from their efforts in building a data culture.
Data Analysis for Equity and Opportunity: Analytical Frameworks in Action
Friday, April 5 10:15 AM ET
In this panel, three library systems share their different approaches to analyzing neighborhood data through an equity lens to guide systemic efforts. Topics include conceptual frameworks, technical foundations, and communicating results. No matter your library size, learn how to use data analysis to get clarity about where you stand on equity and how to empower your organization to make change.
HOW TO Use IMLS’ Public Library Search and Compare Tool
Friday, April 5 11:30 AM (How-To Stage in the Exhibits Hall)
This web-based tool provides an easy way to query, browse, view, and download data on individual libraries from the IMLS Public Libraries Survey. Participants will learn how to (1) search for peer libraries; (2) explore 10-year trends for key metrics; and (3) produce infographic PDFs displaying individual library data or side-by-side peer comparisons.
Additional learning opportunities:
- Check out the shareable resources to spread the word about International Love Data Week 2024 – including customizable materials and activity ideas for patrons of all ages.
- Capturing Library Contributions to Sustainable Development Goals with Project Outcome (on-demand): Learn what the United Nations’ Sustainable Development Goals (SDGs) are and their relevance to public libraries; hear from library leaders how they have applied the SDGs to program evaluation and strategic planning; and learn how you can leverage Project Outcome to capture and share your library’s impact in your community and the impact of libraries worldwide.
- Using Data to Engage Underserved Communities (on-demand): Learn how the Oak Park Public Library in Illinois used data about their community to create a multi-channel, integrated marketing campaign that was specifically designed to reach different segments of the community that historically have been marginalized.
- PLA’s Census Data Literacy Project included 6 free webinars (now available on demand) and two new resource guides. It aimed to help libraries support their patrons in navigating and understanding Census data and to help libraries also leverage that data to better understand and serve their communities.
Tags: lovedataweek, plabenchmark, plasurveys, projectbenchmark, projectoutcome


