Characteristics and Trends in the Public Library Data Service 2010 Statistical Report
Access to timely, accurate, and relevant data is an essential component for public libraries. The Public Library Data Service (PLDS) Statistical Report has been providing such data to the library community since 1988. PLDS is an annual survey conducted on behalf of the Public Library Association (PLA) where public libraries from the United States and Canada provide information on finances, library resources, annual use figures, technology, and additional yearly special categories. The results of this survey are published by PLA and available as an online subscription longitudinal database containing five years of data and also as yearly print reports. Results that are available directly in that report are not duplicated in the analysis presented here. Not all data points from the PLDS report are analyzed.
Rather, this article presents trends and insights across the data and across population groups.
Highlights
- Per $1,000 of expenditures, libraries tended to experience slightly greater output in all measures than last year, reversing last year’s trend.
- Income and expenditures per capita decreased, but not significantly from last year.
- At 96.99 percent, nearly all libraries responding possessed a website, and 94.18 percent of responding libraries supplied wireless Internet access. Most other technology trends remained stable except an increased availability of wireless Internet.
- Circulation per capita varied significantly by population grouping but circulation per registered borrower did not vary significantly by population grouping, showing that libraries of all sizes were serving actual patrons at approximately the same rate on this measure.
- Print circulation was approximately double that of CD/DVD circulation on average for the first year that these individual circulation counts were collected.
- By inviting all libraries to participate in the PLDS survey, libraries serving a smaller population increased their participation rate in the survey and the total number of survey responses increased. This necessitates comparisons within population groups or other characterizations as opposed to averages across all libraries when performing longitudinal analysis of PLDS data.
Research Method and Context
This article uses data from the PLDS 2010 Statistical Report. In 2010, unlike previous years, all public libraries in the United States and selected Canadian public libraries were invited to participate in the survey. Also, postcards were used for invitations instead of letters as in previous years to defray the increased costs from the much larger invitation pool. These were complemented with e-mails to the small set of library respondents from past years who supplied valid e-mail addresses. The 2010 response rate was 11.9 percent, or 1,105 of the 9,272 libraries who were invited to participate in the PLDS survey (compared with 852 from 2009 when a smaller pool was utilized). A higher response rate may have been possible with more advertising of the survey and if a more expensive distribution method of invitations was utilized, but an overall increase in total responses was achieved. Nine hundred eighty-seven of these libraries completed more than 20 percent of the survey, were validated following data checking, and were included in the final report and online database. For this article, all valid answers were analyzed where possible and appropriate, including libraries that did not answer more than 20 percent of the survey. For each of the continuous variables, the following statistics were obtained: number of libraries reporting, minimum, maximum, mean, and standard deviation.
For each of the categorical variables, frequencies of responses and percentage of libraries responding were calculated. Calculations were completed using Microsoft Excel 2007 and SPSS v.19. For copies of the survey and full wording of the questions included, please refer to the statistical report or longitudinal
database.
Overall Service
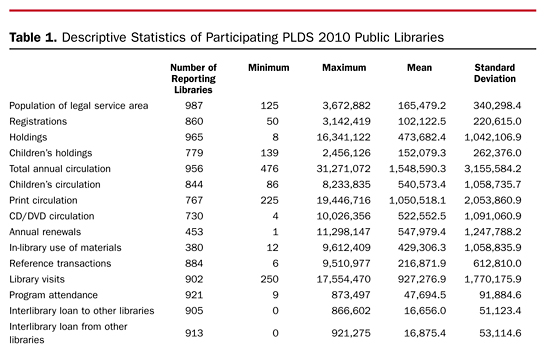
Table 1 provides a statistical summary of selected characteristics of participating PLDS 2010 libraries. The responding libraries in the PLDS 2010 Statistical Report ranged in size from those serving 125 to 3,672,882 people in their legal service areas. Figure 1 presents the distribution of participating libraries by population of legal service areas represented. The expanded survey pool allowed for an increased level of participation among libraries with smaller legal service areas than in earlier PLDS surveys. This change in research pool as expected changes overall statistical averages, but did not affect statistics when pooled by population groupings. Overall for the 2009 fiscal year, 860 PLDS libraries responding to the appropriate questions served 87,825,383 registered patrons from a population of 163,327,973 in the United States and Canada.
The PLDS survey includes descriptive characteristics on a variety of important library statistics (see table 1). For example, in the 2009 fiscal year, library holdings ranged from as little as 8 to 16,341,122 items among the 965 reporting libraries. Children’s holdings (or at least items that libraries self-identified as children’s, which could be misrepresented to mean available to children and not simply present within a special section) represented 32.1 percent of totalholdings on average by libraries reporting this value. PLDS libraries also circulated items 1,548,590 times on average, representing a reduction of 16.6 percent over last year’s average, but indicative of the change in overall sample. Total circulation of children’s materials could not be directly compared or removed from this value because they were specifically defined to include renewals in all cases, which the general circulation question did not require; however, this value showed an average count of 540,573. For the first time, the PLDS Report also included circulation counts for independent materials in 2010. Of libraries reporting counts, print items were circulated 1,050,518 times on average and CD/DVD items were circulated 522,552 times on average. Since not all libraries reported all counts, these should not be directly compared to the overall circulation average mentioned previously. For those including annual renewals in their circulation counts, 547,979 or 35.3 percent of the total circulation, was accounted for by renewals on average. Meanwhile, materials were counted as used within the library 429,306 times on average.
In other areas of service, PLDS libraries on average performed 216,872 reference transactions, had 927,277 library visits, provided programs to 47,694 patrons, and provided 16,656 materials to other libraries, while receiving 16,875 materials from other libraries annually. All of these numbers represent decreases from last year of 10.8 to 28.2 percent showing the change in population sample once again.
Selected Library Services by Population
The population of legal service area of individual libraries influenced many relevant output measures. Several of these measures are visualized in figures 2–7. For the most part, the trends have followed the same patterns or lack thereof as past years. For some of the trends analyzed, a pattern can be seen in the visualizations.
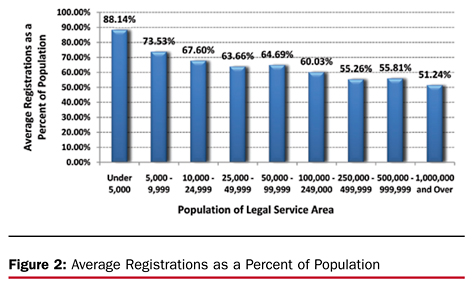
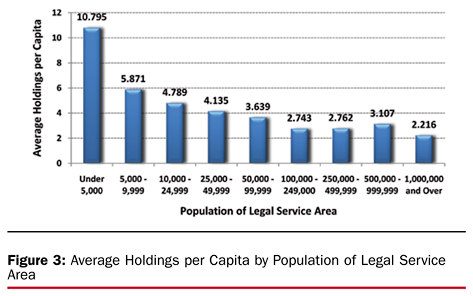
For example, when viewing library registrations as a percent of population (see figure 2), the percentage increased as the population size decreased, going from 51.24 to 88.14 percent. Average holdings per capita show an even more dramatic shift with population served (see figure 3). Libraries serving populations under 5,000 had average holdings more than 4.87 times than those of the largest libraries. Generally, as the population served grew, the average holdings per capita decreased. Libraries serving populations of 5,000 to 9,999 individuals had the second highest value of average holdings per capita at 5.871 and were 2.65 times as large as the lowest value of 2.216 for libraries serving more than 1,000,000 individuals. Holdings per capita (F(8,956)=59.4, p<0.001) and holdings (F(8,956)=141.5, p<0.001) varied significantly by population group. The overall average holdings per capita for all reporting libraries was 4.71 items (n=965). This value increased 25.9 percent from last year showing the effect introduced by the increased number of smaller libraries in the respondent pool.
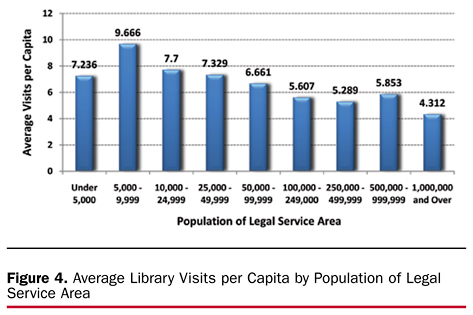
Although not as skewed as registrations or holdings, library visits per capita also showed a larger value for libraries serving smaller populations; although the largest value was actually seen for libraries serving populations of 5,000 to 9,999 (see figure 4). These libraries saw 2.24 more visits per capita than libraries serving more than 1,000,000. All libraries serving populations under 50,000 saw more than 7.2 visits per capita annually. Both library visits per capita (F(8,893)=4.911, p<0.001) and total library visits (F(8,893)=282.5, p<0.001) varied significantly by population group. The overall average library visits per capita for all reporting libraries was 6.83 (n=902) showing a 10.5 percent increase from last year due to the increased participation of smaller libraries.
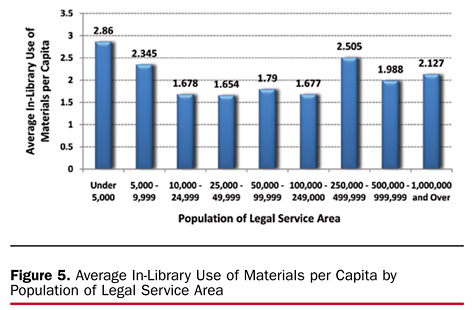
Unlike previous years, most of the remaining library services statistics did not show a clear pattern by population groupings. In-library use of materials saw the largest number for libraries serving a population below 5,000; however, the second largest number was for libraries serving a population of 250,000 to 499,999, with middle-sized populations having the smallest values (see figure 5). The average in-library use of materials per capita for all libraries reporting was 2.015 (n=380). Enough libraries from each population grouping did not complete this question for valid cross-analysis.
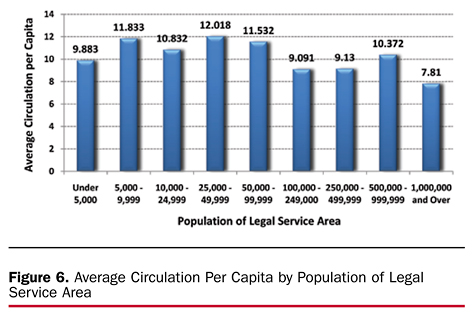
Average circulation per capita, although showing the smallest value for the largest population group, still showed a mostly linear pattern by population groupings (see figure 6). The average circulation per capita for all libraries reporting was 10.50 (n=956). Overall, the value of circulation per capita (F(8,947)=2.335, p<0.05) and total circulation (F(8,947)=239.5, p<0.001) differed significantly by population group. Also, the values of print circulation (F(8,758)=176.0, p<0.001) and CD/DVD circulation (F(8,721)=105.0, p<0.001) varied significantly by population group. When looking not at the population, but only at the registered borrowers though, the circulation per registered borrower does not vary significantly by population grouping (F(8,864)=1.657, p=0.105).
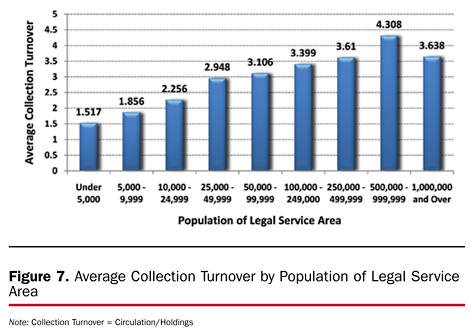
Collection turnover allows a librarian to see how often items within the collection are being used by dividing the total circulation by the total holdings. When analyzing collection turnover (see figure 7), the graph skewed in the opposite direction as other figures. Larger population libraries had a significantly larger average collection turnover than smaller population libraries (F(8,934)=12.186, p<0.001), with the largest collection turnover for libraries serving a population of 500,000 to 999,999 and the smallest collection turnover for libraries serving a population below 5,000 (a 2.84x difference). The overall average for all reporting libraries was 2.829 items circulated per item held (n=943), a 5.3 percent decrease from last year due to the increased participation of smaller libraries.
While overall averages are reported here and are a useful means for a general picture of library services, the net effect of the change in survey population has resulted in an overall adjustment in all of the given averages this year. However, when one looks specifically at a single population grouping, a certain value may be more informative for a given library. For example, if one looks only at visits per capita for libraries serving a population of 25,000 to 49,999, the net percent change was -1.5 percent as opposed to the +10.5 percent for the sample as a whole. Being able to make such comparisons highlights the usefulness of such comparative data in the online database. Still, a potential overall shift in usage patterns may exist since many of the population patterns seem to be following the overall average patterns. A more thorough analysis has not yet been conducted though, as one needs a few more years with the new sample population to build enough longitudinal data for a valid analysis.
Operating Finances
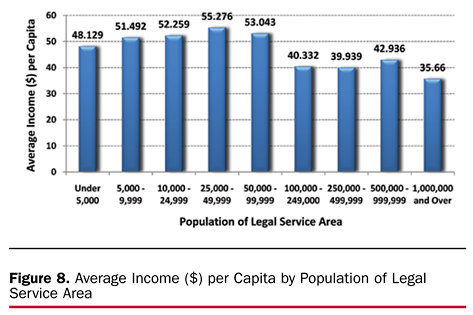
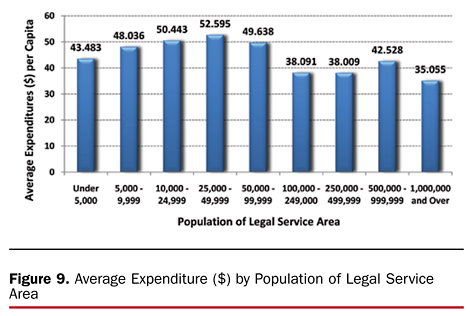
Income and expenditure measures are a primary concern of many libraries and are therefore a major section within the PLDS Report. Averaged over all respondents, library income was $48.01 per capita in the legal service area (n=974; $48.61 last year) while library expenditures were $45.31 per capita in the legal service area (n=962; $45.65 last year). The overall income and expenditure averages and the averages for most populations groupings except those below 5,000 remained practically the same as last year. Income and expenditures per person were largest for the libraries serving middle-sized populations and smallest for libraries serving the largest populations (see figures 8 and 9). Fluctuations by population were relatively identical between income and expenditure. Income per capita (F(8,965)=2.717, p<0.01) and expenditure per capita (F(8,953)=81.344, p<0.005) varied significantly by population group.Total income (F(8,965)=254.3, p<0.001) and total expenditures (F(8,953)=237.2, p<0.001) also varied significantly by population group. Total income on average exceeds total average expenditures for all groupings.
Although income and expenditures are usually compared against total population, resulting in significant statistical results, when they were compared against total registrations, a different result is seen. Fluctuations in income per registration (F(8,842)=1.257, p=0.263) and expenditure per registration (F(8,832)=1.185, p=0.305) were not significantly different by population grouping. This year the PLDS survey divided materials expenditures into categories by type of material. Overall, libraries spent $5.72 per capita on materials but the variability was large with a range of $0.05 to $68.68. As with the total expenditures, the expenditures on materials in total and the expenditures on materials by all types were seen to vary significantly by population groups (FMaterialsTotal(8,953)= 212.8, p<0.001; FMaterialsPrint(8,922)=181.2, p<0.001; FMaterialsCD/DVD(8,834)=126.7, p<0.001; FMaterialsElectronic(8,893)=164.9, p<0.001).
Library Outputs in Relation to Expenditure
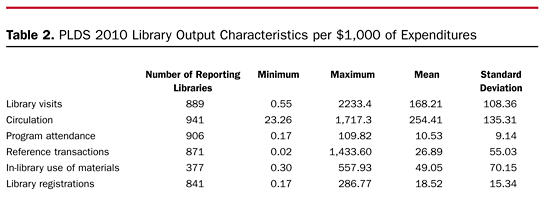
Often there is a need to validate that expenditure has yielded a desired result within a public library. Table 2 summarizes various library outputs as a function of expenditure. In 2010 per $1000 spent, libraries on average received 168 (149 last year) library visits, circulated 254 (235 last year) materials, saw 10.5 (9 last year) patrons attend programs, fielded 26.9 (29 last year) reference transactions, measured 49.1 (48 last year) uses of materials within the library, and registered 18.5 (17 last year) new patrons. Compared to 2009 survey values, most numbers were up slightly on average, meaning that per $1,000 of expenditures, libraries were experiencing slightly more output measures on average. This increase reverses a trend from the previous year.
Technology
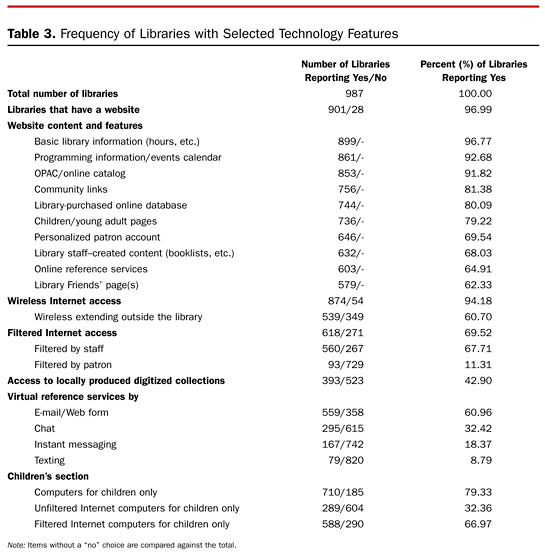
Technology is a major component in the modern public library that has become indespensible in numerous aspects. The majority of PLDS libraries made use of numerous technology tools and services as shown in table 3. The number of libraries that reported having a website rebounded from last year’s low of 92.43 percent back to 96.99 percent. The contents of these websites remained relatively constant with basic library information (96.77 percent), programming information and events calendars (92.68 percent), online catalogs (91.82 percent), community links (81.38 percent), and available online databases (80.09 percent) being the most prevalent items. Other website features were less prevalent, but all options were present greater than 60 percent of the time.
The technology category showing the largest change from last year was the use of wireless Internet. The availability of wireless Internet rose from 88.22 percent last year to 94.18 percent this year. Furthermore, libraries with wireless Internet access extending outside the library rose dramatically from 46.03 to 60.70 percent. When Internet access was filtered, it was generally performed by the library staff. Use of filtering rose 4.28 percent up to 69.52 percent this year overall. For 67.71 percent of reporting libraries, Internet access was filtered by staff, while only 11.31 percent of libraries allowed patron control of Internet filtering. These numbers are not exclusive in that a library may allow filter control by both staff and patrons.
The increase in virtual reference services seen over the last couple of years no longer occurred in last year’s survey. The use of these services remained about the same and in the same order of preference with e-mail/Web forms used twice as often (60.96 percent) as online chat services (32.42 percent) which were nearly twice once again as instant messaging (18.37 percent) which was itself twice again the final new category of texting services at 8.79 percent.
Access to locally produced digitized content remained essentially the same as last year at 42.90 percent.
This year’s special section on children’s services measured technology use by children in several areas. Of particular note, 79.33 percent of libraries specified having computers available for use by children only. Of computers for children’s use only possessing Internet access, 66.97 percent were indicated as filtered and 32.36 percent were indicated as unfiltered.
Future Directions
The 2011 PLDS survey will run from January to April 2011 and will include a special section on public library finances. These data will prove useful for analysis of important financial figures in today’s uneasy economic times. Also, now that all libraries are invited to participate, a broader and more complete statistical landscape can be attained from this data. Any library not receiving an invitation is encouraged to contact PLA for more information (Kathleen Hughes). More longitudinal analysis through the PLDS database will become available with the increased participation of smaller libraries, in particular, to help determine to a better degree their impact on these statistics as indicated in this report. Furthermore, one can look forward to programming developments within the PLDS database currently being discussed. Since the Institute of Museum and Library Services has introduced locale codes into the national public library survey, PLDS is considering population density as a new database category for the future. More data availability and better tools to manipulate and analyze that data in meaningful ways can only help further the needs of public libraries.
Tags: PLDS