3 Numbers about Mobile Usage that Impact Libraries
The 2015 Q2 Mobile Overview Report (MOVR), published by ScientiaMobile, dropped over the summer. It’s a quarterly data-dump of worldwide mobile device usage —specifically excluding desktops, laptops, smart TVs, game consoles, apps, and robots—which breaks down trends and provides perspective about the ever-shifting mobile web. For libraries already involved or looking to move into web or application development, or for those vendor-shopping third parties who provide this sort of thing, these and other reports play increasingly important roles informing the kinds of content and collection decisions we make.
Using an open-source device detection repository called WURFL (uh, “were full”), ScientiaMobile logged 12 billion requests over three months from all sorts of devices connected to the internet. For mobile overview reports they exclude everything but hits from smartphones, tablets, and feature phones.
What is a Hit? Each time a user visits a Web page and a UA is generated and tested by WURFL (through a number of mechanisms), a “hit” is recorded in the ScientiaMobile dataset. All data reported in MOVR reflects hits, not the count of physical devices generating the hit.
Here are three of the numbers that captured my attention:
4 Seconds
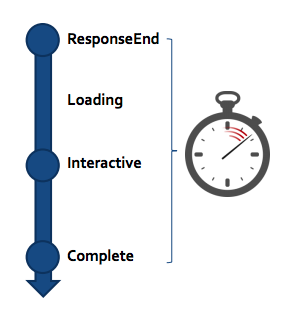 The average load time on mobile is about four seconds. Type of connection—3G, 4G, LTE, WiFi, or something else—isn’t part of the report, but we know the majority of the devices are smartphones using Android or iOS. Okay, you could have guessed that. But the potential speed difference between 3G and WiFi is enormous, and we should be interested in how that breaks down. While overall web traffic from tablets makes up less than a third, the Adobe Digital Index 2014 U.S. Mobile Benchmark reported that 93% of this traffic is over WiFi, enough—I think—to skew MOVR’s load time average. My gut feeling is that a four second load for mobile devices is optimistic if those devices aren’t on WiFi but—I digress.
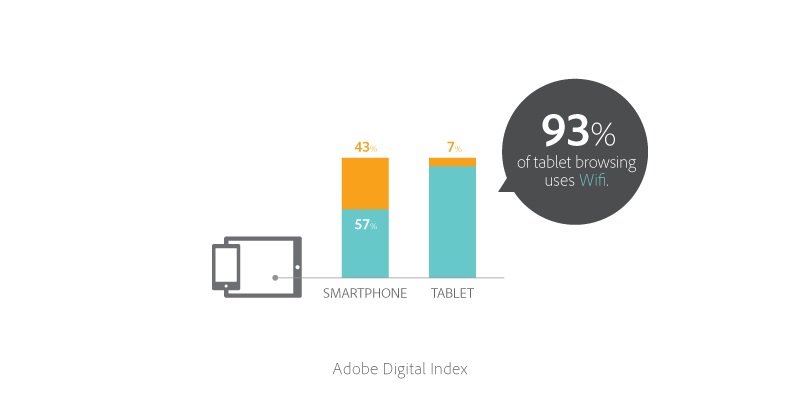 This is an important benchmark when considered with other data showing the importance of web page speed in terms of user behavior. For instance, the 2014 Radware Mobile State of the Union suggests that almost half of mobile users expect pages to load in just two seconds, and of them a whopping 40% will abandon a page taking longer than three. So, if the average mobile user is already in a perpetual state of uggggh come onnnnn then trying to connect to a slow library website or database isn’t doing much for his or her opinion of us.
9 Seconds to Scroll
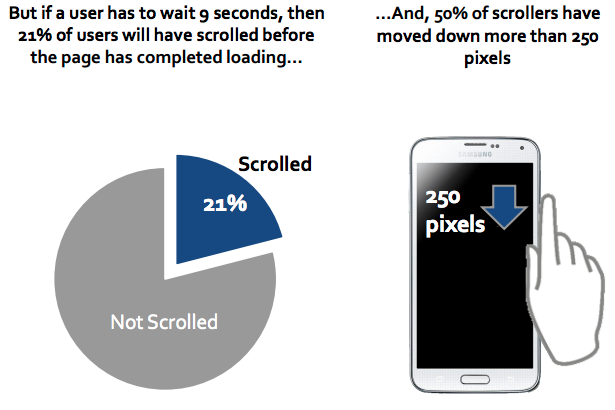 21% of people start scrolling before the page finishes loading. They might just scroll past the upcoming events or new resources at the top of the page that libraries are trying to promote. Whoops. Chalk that up to “above the fold” irony.
55% Worldwide Smartphone Adoption
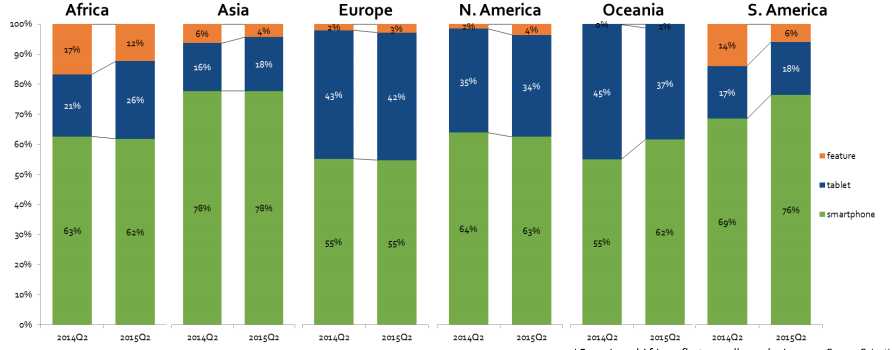 More library users than not have a touch screen that connects to the Internet in their pocket. In the United States, 63% of web traffic originates from a smartphone. This number aligns with the Pew Research Center report most recently updated in October 2014, adding additional context by noting that as of last year more than “90% of American adults own a cell phone,” 42% own a tablet. Of them, 34% “go online mostly using their phones, and not using some other device such as a desktop or laptop computer.”
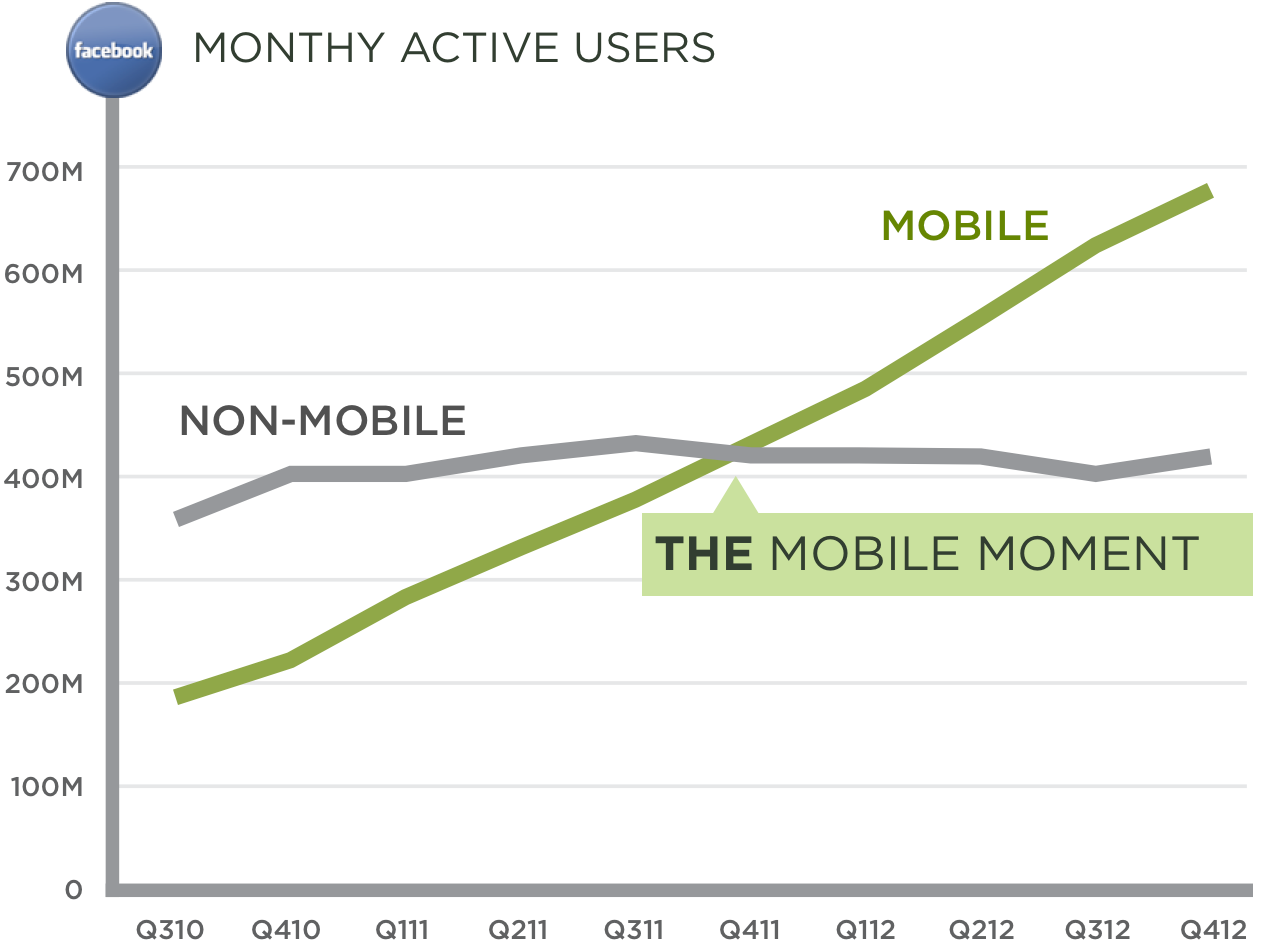
These trends hearken back to an industry prediction coined by Googler Luke Wroblewski called “the mobile moment.” That is, the point at which mobile traffic to an organization’s website eclipses traditional non-mobile traffic, such as from a desktop.
 The pressure for libraries to make their websites mobile friendly increases from quarter to quarter as the upward trajectory makes itself more distinct.
About MOVR
ScientiaMobile MOVR reports as well as the raw data for your perusal are available under flavors of creative commons licensing at http://www.scientiamobile.com/page/movr-mobile-overview-report. There you can find previous reports, infographics, highlights, or sign-up for notifications of future reports.
References
- “MOVR Mobile Overview Report April – June 2015,” ScientiaMobile, July 2015.
- “Adobe Digital Index } U.S. Mobile Benchmark Report – 2014.”
- “2014 Radware Mobile State of the Union,” Radware Ltd.
- “Mobile Technology Fact Sheet,” Pew Research Center, October 2014/
- Wroblewski, Luke. “The Mobile Moment,” Luke W Ideation + Design, December 29, 2013.