The 2017 Public Library Data Service Report: Characteristics and Trends

Ian Reid is VP, Customer Service, and Carl Thompson is President, Counting Opinions (SQUIRE) Ltd., Toronto. Contact Ian at ireid@countingopinions.com. Contact Carl at cthompson@countingopinions.com. Ian is currently reading The Dark Tower by Stephen King. Carl is currently reading Seniority by Shawn O’Shea.
The Public Library Data Service (PLDS) annual survey is conducted by Counting Opinions (SQUIRE) Ltd. (CO) on behalf of the Public Library Association (PLA). This 2017 survey of public libraries from the United States and Canada captured fiscal year 2016 (FY2016) data on finances, resources, service usage, and technology. Each year PLDS includes a special section. This year the supplemental questions focused on young adult services.
The PLAmetrics online service offers subscribers access to the longitudinal PLDS data sets from FY2002. Also included is the Public Library Survey (PLS) annual data (from FY2000) as provided by the Institute of Museums and Library Services (IMLS). PLAmetrics provides real-time access to meaningful and relevant public library data for peer benchmarking and trend analysis using a custom reporting service.
This report includes an analysis of selected measures from the FY2016 PLDS and trends, conducted by CO using the PLAmetrics reporting service.
Research Method and Context
Participation in the PLDS is voluntary and participants have the option to provide responses to any and/or all questions that comprise the survey. As in previous years, public libraries in the United States and Canada are invited to participate in the survey.
CO sent 5,564 emails to launch the survey (January 2017). In addition, public libraries and state agencies were noti ed of the survey via email, social media, and web page posts. Postcards promoting participation were handed out at the American Library Association (ALA) Midwinter Meeting (2017). In total, over 5,591 unique libraries were contacted. Follow-up letters and emails were sent throughout February and March. The original deadline for submission (March 31, 2017) was extended to April 30, 2017.
State data coordinators from the U.S. and Provincial/Association coordinators in Canada were contacted about promoting the survey to their libraries. Their involvement led to increased participation including, 3,055 (2,704 in 2016) of U.S. and Canadian public libraries partially or fully responding to the request for data, a response rate of 54 percent (a 12.9 percent increase over 2016).
Copies of the survey including definitions are available online via the PLDS Survey site and at www.plametrics.org.
Summary
The following summary of key findings is based primarily on analysis of results from the cohort of continuously reporting libraries:
- Over the last five years library programs per capita have grown at a rate (6.3 percent) twice the decrease in circulation per capita (-3.0 percent).
- Since 2012, staff expenditures (representing over 67 percent of operating expenditures) increased 7.05 percent while the number of staff/capita decreased -1.5 percent.
- Electronic circulation is growing steadily at a rate of 11.7 percent, but not sufficiently to off set the decline in physical materials circulation.
- Consortial sharing relationships for electronic materials significantly increased Holdings for libraries with a Population of Legal Service Area <100,000.
- Declines in circulation may in part be a result of changes in measurement over time (differences in circulation policies especially for electronic materials) and due to an overall decline in library usage that mirrors the de- cline in unemployment rates (that have dropped steadily since 2011), reductions in usage of CD/DVD materials and a slowing uptake in electronic usage.
- While expenditure on CD/DVD materials ($2.26/capita) decreased $0.02 in FY2016 there was a decline in share (-4.08 percent) of overall circulation.
Operating Finances
Figure 1 shows that since FY2012, library income per capita increased $3.87, an average of 2.9 percent/year, whereas the US and Canadian economies grew at an average annual rate of 2.06 percent and 1.86 percent respectively over the same period.1
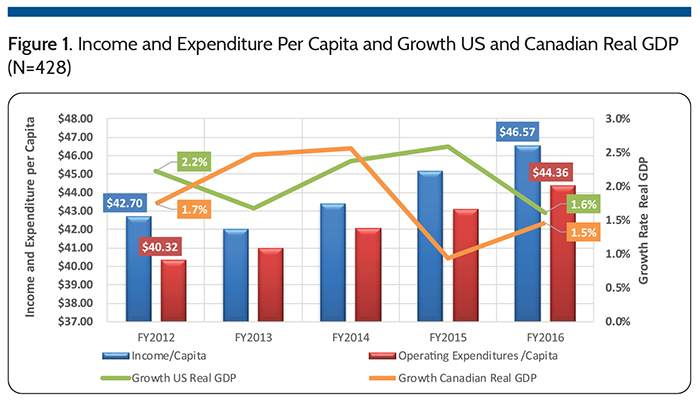
In the year between FY2015-16 the library group serving populations between 100,000 and 499,999 received the largest increase in income per capita, 5.2 percent (N=144), compared to increases of 2.3 percent (N=221) for those serving populations under 100,000 and 2.2 percent (N=63) for those serving populations over 500,000. Large library expenditures increased at 2.9 percent, a 0.7 percent rate higher than their change in income. Expenditures for the small and medium libraries increased at 1.3 percent and 3.7 percent respectively.
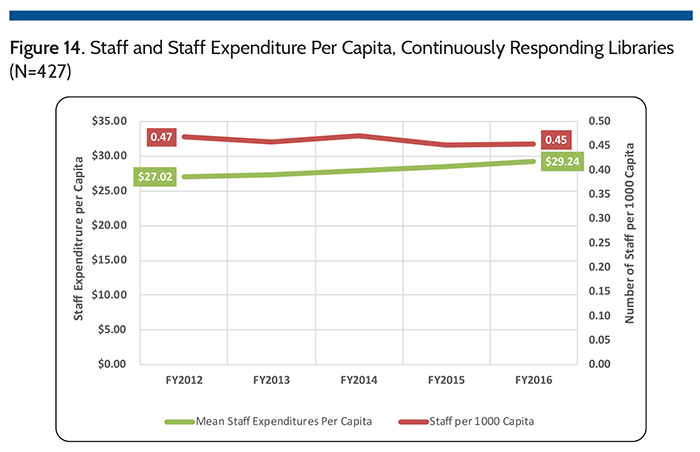
Figure 2 shows the five-year trends for the continuously responding libraries for staff (N=428), materials (N=428) and other expenditures (N=426) per capita since FY2012. Since 2012, spending has increased $2.22/capita (1.99 percent annually) on staff, $0.39/capita (1.89 percent annually) on materials, and $1.36/capita (3.81 percent annually) on other expenditures. As discussed later in this article, number of staff per capita has decreased -3.4 percent since FY2012, suggesting the combination of hours worked, staff composition, and costs and not overall head counts, are driving the increase in staff spending.

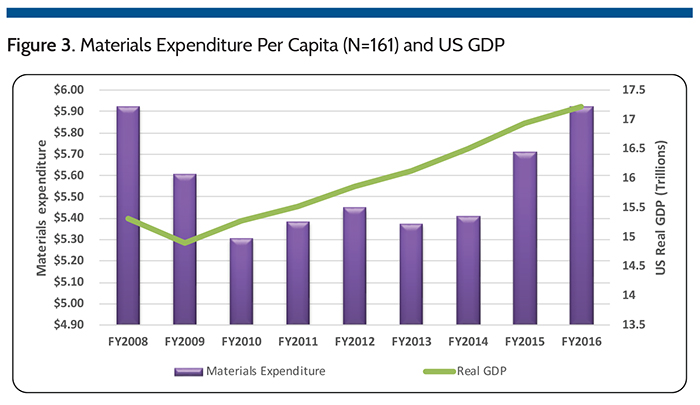
Based on those libraries that have responded continuously for the past ten years (N=161), spending levels on materials in FY2016 ($5.92 per capita) is just shy of the pre-recession levels ($5.93 per capita) which peaked in FY2008 (Figure 3). This pattern of spending also appears to be consistent with the growth in US GDP (most continuously responding libraries being American).
Service Levels
Figure 4 shows a significant increase (5.4 percent) in holdings per capita in FY2015, which increased from 2.83 to 2.86 items per capita (0.9 percent) in 2016. It bears noting that the FY2015 increase in average holdings per capita was primarily the result of several libraries reporting, for the first time, electronic materials holdings accessible through consortium agreements (see also Table 2 and related discussion).
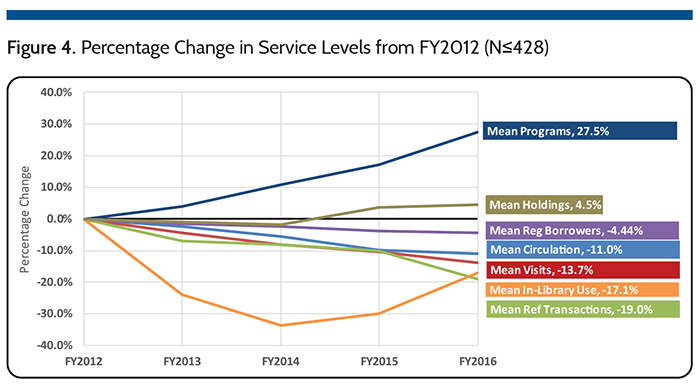
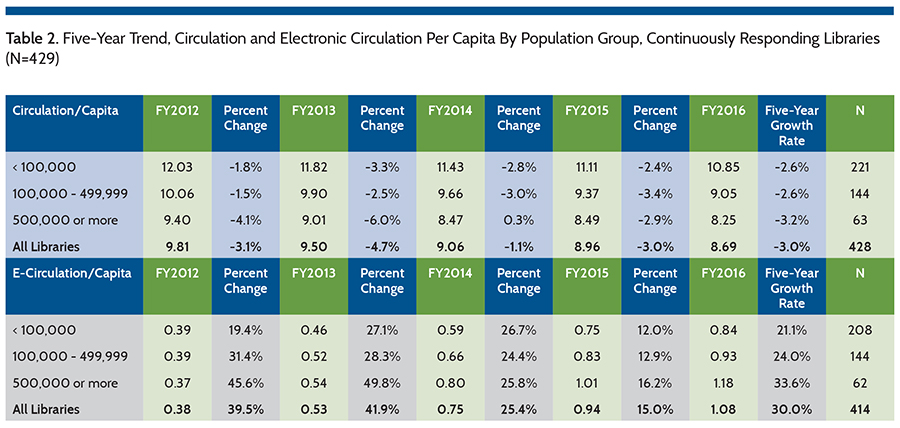
Figure 4 also shows that since FY2012, almost all output service level indicators (on a per capita basis) continue to decrease except for programs (11.7 percent), and in-library use (0.28 in-library uses/ capita), which has rebounded significantly since FY2014, but still well below FY2012 counts. In the past year (FY2015-16) the following have decreased (least to greatest: circulation (-3.0 percent), visits (-3.6 percent), and reference transactions (-9.8 percent). Since 2012, only programs per capita (27 percent) from 11.97 to 15.26 programs/capita. This increasing emphasis on programming is one indication of how library services are transitioning. Pew Research, found from the “Libraries 2016” survey that 80 percent of respondents (U.S. adults 16 and older) say libraries should offer programs to teach people digital skills.2 As programming gains importance and requires more resources of the library (money, staff, space, collateral, equipment, etc.), libraries will need to better prepare to demonstrate their efficiency and effectiveness in service delivery. Efforts by the PLA and Project Outcome support measures of program effectiveness that are increasingly important. Libraries will also need to find better measures of program delivery costs and efficiencies, to complete the new measures of effectiveness in programming as evidence for stakeholders to support libraries as they maintain and grow these services.
It is equally important to better inform library administrators as they allocate resources. Currently, most data sets (PLDS included) have no data on budgets and program development expenditures. These might be combined with “other expenditures” and/or buried in the “staff” costs. While it is reasonable to assume that as more programs are offered, costs are also increasing, currently there is no data support measures at a macro level, and in most instances, libraries do not know their true programming costs at a micro level (e.g., per program, per participant, etc.). Currently, therefore, it is difficult to assess the impact on budgets resulting from increases in library program service delivery and on comparative resource allocations.
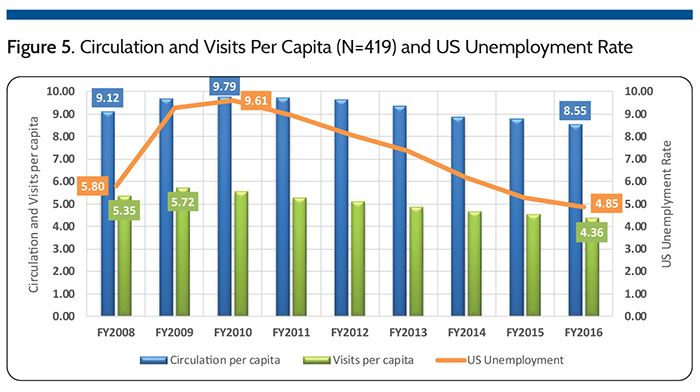
Unemployment rates more than doubled in the United States (Figure 5) during the recent recession.3 At the same time, library visits and circulation increased before steadily decreasing as unemployment declined to pre-recession levels. This is not likely the only factor affecting the decline in traditional measures of library usage, but it does indicate why libraries now need to consider new and better measures of their efficiency and effectiveness.
Materials Expenditures and Usage
Table 1 shows mean materials expenditures by population group since FY2012. Small and Medium Libraries serving populations less than 500,000 generally show year-over-year increases in mean expenditures. Medium and Large libraries show more variable spending on materials. The larger libraries serving populations of 500,000 or more spent more on materials in FY2016 than the previous 4 years, a 6.2 percent increase over FY2015. Ten large libraries reported greater than 25 percent increases in material spending compared to FY2015; resulting from increases in mill levies and other funding increases.
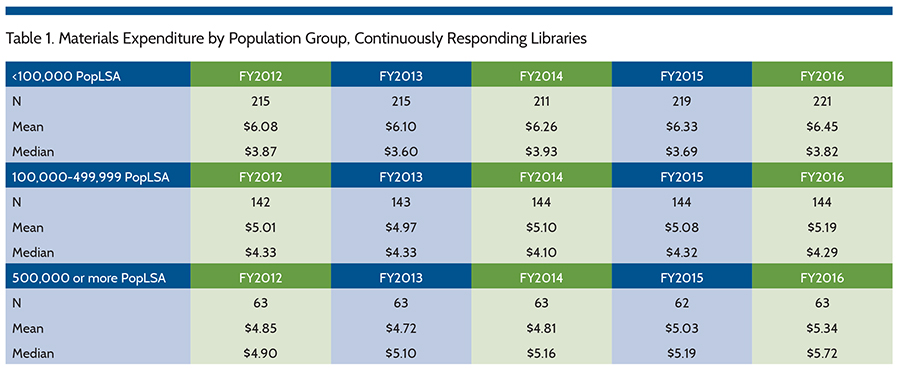
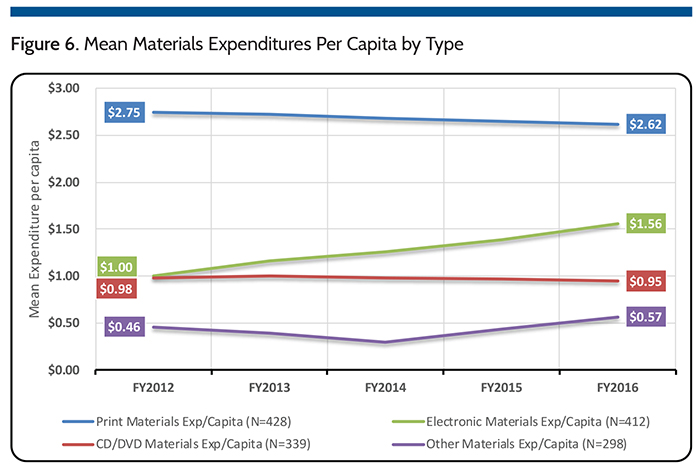
Figure 6 shows changes in mean materials expenditures per capita by type. Mean electronic materials expenditure increased $0.56 (55.9 percent). While average spending on print materials decreased $0.12 (-4.5 percent) and mean CD/DVD expenditures decreased $0.03 (-3.2 percent). Mean other material expenditures increased $0.11 (23.2 percent).
These per capita spending trends align with patterns of usage that emerge from the data. For example, among the continuously responding libraries (N=427), Figure 7 shows per capita circulation by type of material as a percentage of total circulation for those that report circulation by type of material (i.e., not total circulation only).
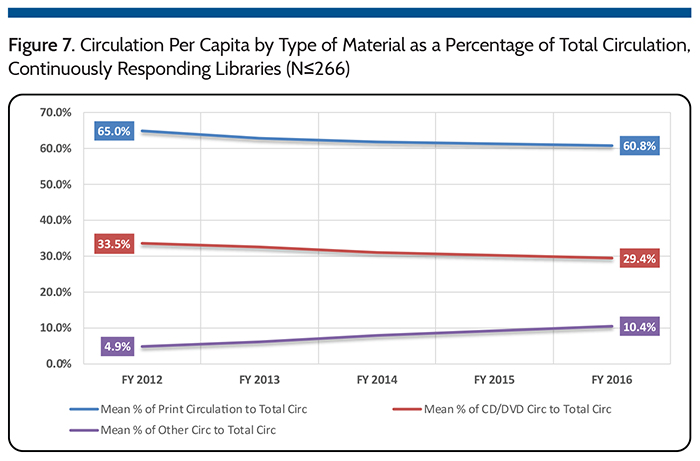
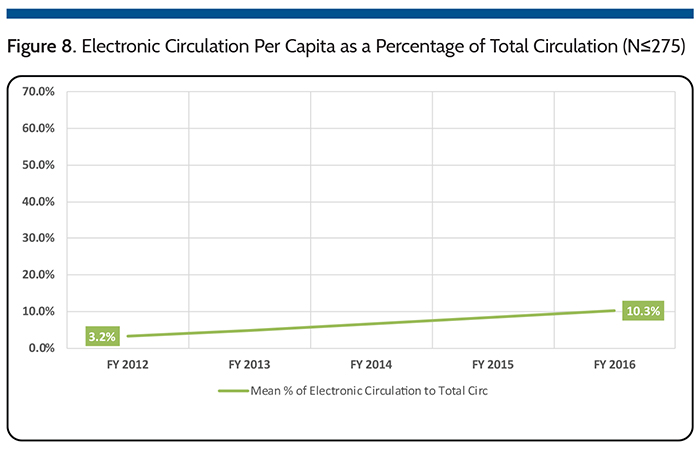
Print and CD/DVD materials circulation per capita continue to decrease relative to total circulation while other materials circulated (includes electronic materials), continue to increase. As a percentage of total circulation per capita, both print circulation and CD/DVD continue to comprise a smaller proportion of overall circulation. Since FY2012, increases in electronic circulation per capita (7.0 percent), as shown in Figure 8, account for a corresponding decrease in CD/DVD circulation per capita (-6.0 percent) and the remaining proportion by the decrease in print material circulation/capita (-4.2 percent).
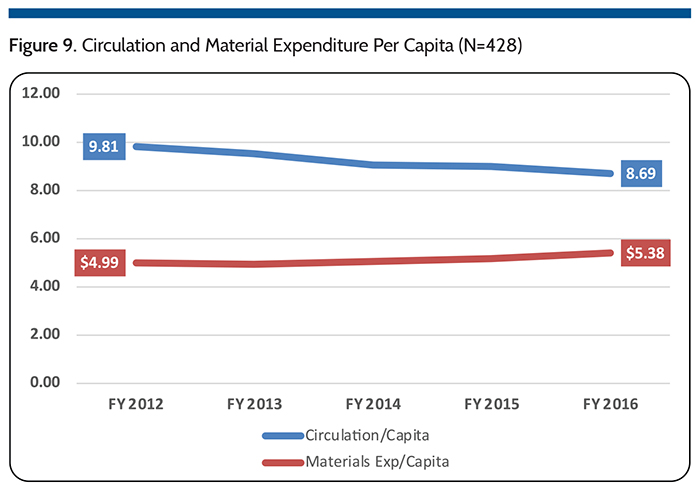
 Correspondingly, libraries are adjusting their spending on materials. As Figure 9 demonstrates, overall circulation per capita continues to decline at a rate of -3.0 percent per year while overall materials spending has increased at a rate of 1.9 percent per year.
Spending on CD/DVD, as shown in Figure 6, is relatively unchanged over the last five years but mean circulation of these items has decreased at -6.5 percent per year, as shown in Figure 10; likely a result of increases in use of music and video downloading services.
Similarly print materials circulation has decreased by -2.9 percent each year, as depicted in Figure 10. Since 2012, print materials expenditure has decreased at a rate -1.1 percent (see Figure 6).
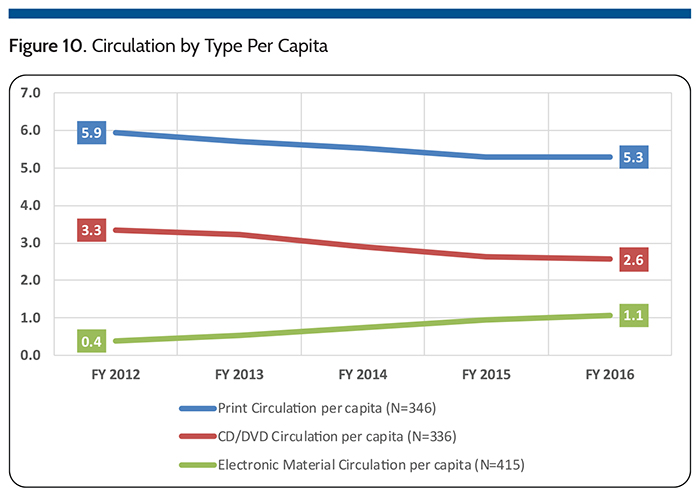
Conversely electronic material circulation continues to expand at a rate of 30.0 percent per year (Figure 10), and expenditure on these materials has increased at a rate of 11.7 percent (Figure 6). Between FY2015-16 Electronic circulation increased at a rate of 15.0 percent indicating the service is maturing and growing at a slower rate each year. The costs for this rapid growth in electronic circulation is not always fully born by each library given widespread use of consortial purchasing arrangements many libraries have engaged in to provide these materials. As a result, spending on these materials has not had to increase at a similar rate.
Table 2 shows the five-year trend for total circulation and electronic circulation per capita for all continuously responding libraries, grouped by population of the legal service area. Large libraries serving populations of 500,000+ show the highest decline in overall circulation per capita (-3.2 percent annually) whereas electronic circulation per capita shows the strongest growth rate (33.6 percent annually).
There are challenges in comparing electronic circulation with other types of materials circulation given the differences in lending policies across materials types. While a circulation means an item has been lent to a library user, a policy that mixes shorter and longer lending periods and/or auto-renewals will impact comparative analysis and turnover rates and other measures of materials availability (for lending). This means that circulation counts between peer institutions and between material types within the same institution and over time, are becoming increasingly difficult to compare. Some policies may not be solely at the discretion of the library especially with e-materials downloaded from third parties and/or as part of a consortium. Factors such as number of copies, simultaneous uses and/or total days of use also factor in consistent measurement of circulation. As a result, the upcoming 2018 PLDS survey includes new questions about circulation policy and counts for various material types, in hopes of developing better measures for understanding these trends.
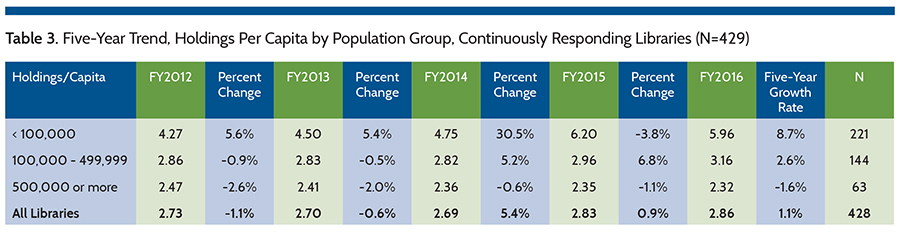
Table 3 shows the five-year trend for holdings per capita for all continuously responding libraries grouped by legal service area. Small Libraries serving populations less than 100,000 (N=222) show the highest per capita increase in holdings (8.7 percent annually), largely impacted by consortial membership agreements providing access to large repositories of electronic materials, first reported in FY2015. The addition of these titles has significantly increased the average number of holdings per capita. Similarly, libraries serving populations of 100,000– 499,999 also increased their holdings per capita in FY2015 (5.2 percent) and FY2016 (6.8 percent). This new reality likely means greater variability in holdings trends given the immediate impact of sizeable changes afforded by such consortial arrangements. The large libraries have reduced their holdings on average -1.6 percent despite higher spending in FY2015-16 as compared to the three preceding years (see Table 1).
Collection turnover rates also reflect the trends in the composition of holdings and circulation. These large increases in holdings have led to lower collection turnover rates. Figure 11 shows that since FY2014 libraries serving populations less than 500,000 have the highest decline in the turnover rate. Larger libraries serving populations over 500,000 show a decrease in holdings over the last five years, with corresponding declines in circulation and turnover.
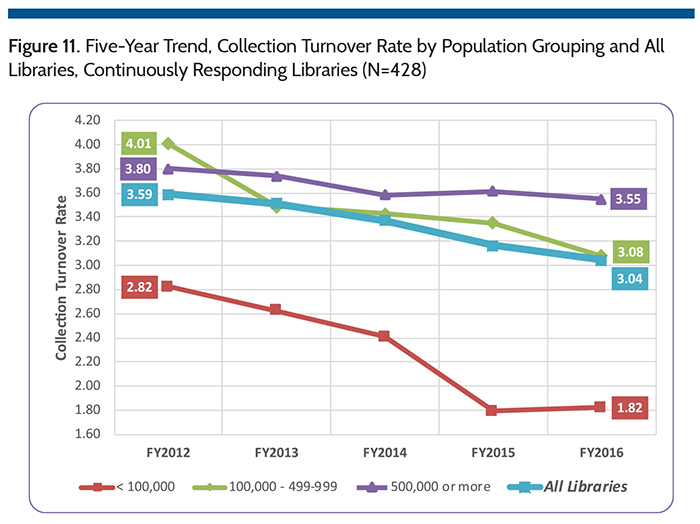
Decreasing circulation and collection turnover rates create a perception that the need for and/or value of libraries is somehow diminishing. Instead these measures continue to emphasize that the mix of library services are changing, and that holdings and circulation counts are increasingly becoming more difficult to consistently measure.
Programs and Attendance
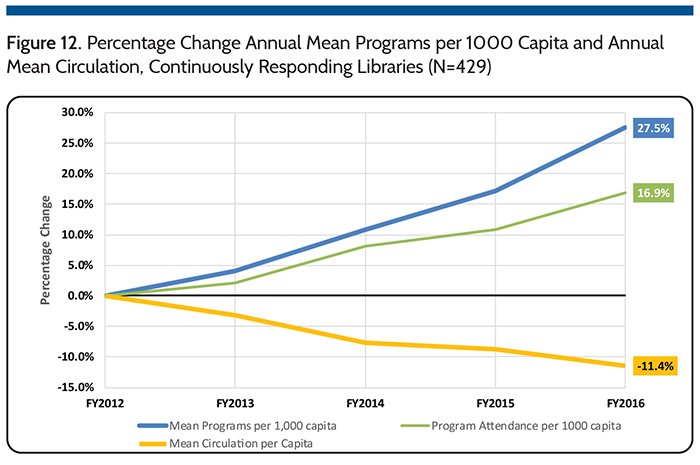
In contrast to the downward trend in circulation/capita (-11.4 percent since FY2012), there has been significant growth in programs per capita (27.5 percent since FY2012) and program attendance per capita (16.9 percent since FY2012) (Figure 12). Interestingly, circulation/capita has decreased annually at a rate of -3.0 percent since FY2012, programs per capita has increased by more than twice that rate (6.3 percent) and attendance per capita a rate of 4.0 percent.
While libraries continue to invest in holdings (despite decreasing use), it is apparent that they are allocating more resources to programming although there are no specific measures available to confirm this other than the obvious. Programming competes for resources including space, personnel, equipment, materials, management time, time spent on community engagement, and more. As this trend continues, library management will increasingly need better ongoing measures (efficiency and effectiveness data) as they adapt and optimize the mix of traditional and new services including programming.
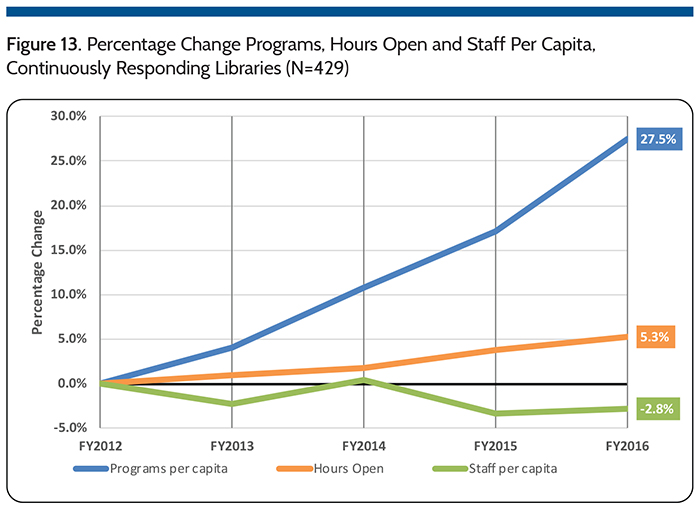
Figure 13 contrasts the rate of increase in programming with a much slower growth in hours of operation and declines in staff per capita. If the growth in programming continues, it may be constrained by potential capacity issues, such as hours open, staff resources and space, although these may not be of immediate concern depending on where/when and how programs are delivered (in-library, online, asynchronously, in community). Nevertheless, expanding the number of hours open to accommodate more programming (perhaps at more convenient times) implies a potential increase in commitment for additional resources, including staff. Correspondingly, there will be a need for libraries to justify those commitments.
Staff
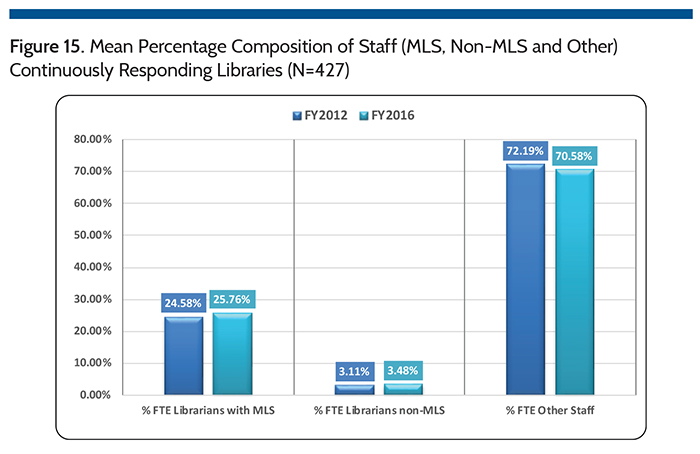
In the past five years, as shown in Figure 14, little has changed regarding staffing head counts among the continuously responding libraries (N=429). The average number of staff is relatively static over the past five years decreasing at a rate of -0.71 percent, mostly due to the increase in population over the same period (1.0 percent). Since FY2012, staff expenditure per capita increased at a rate of 1.99 percent with the largest increase (2.3 percent) in FY2016. Staff expenditure are increasing faster than the number of staff. The increase reflects changes in the composition of staff and/or costs per person and/or hours per staff member. Figure 15 compares FY2012 with FY2016 results for the average percentage of MLS, Non-MLS and other staff for the continuously responding libraries. In the last five years, the average percentage of MLS librarians has increased at a rate of 0.71 percent. The average percentage of Non-MLS librarians has increased faster (3.50 percent), o set by declines in other staff (-1.30 percent) which are likely lower on a per capita basis (due to the increase in population over the same period).
Technology
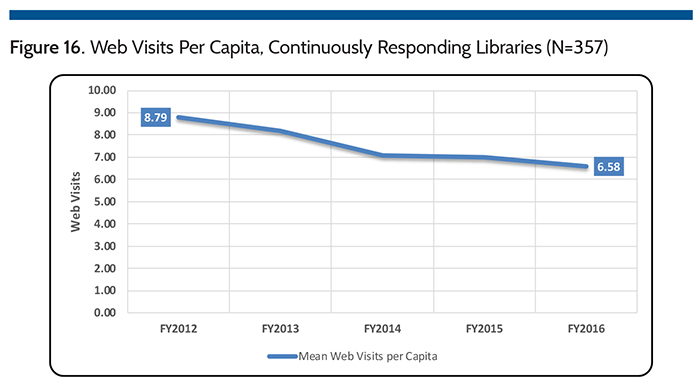
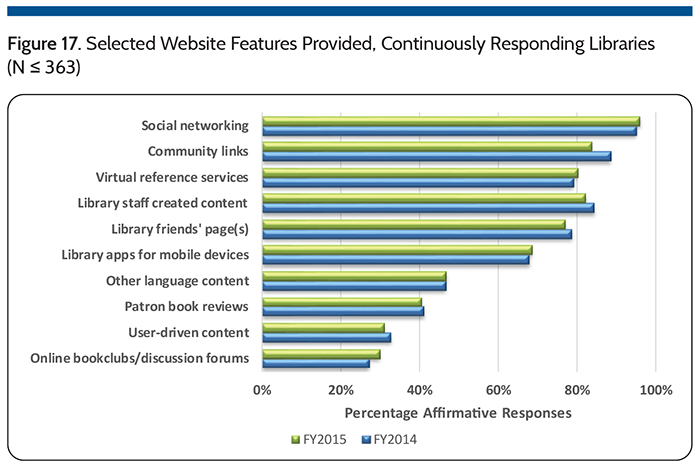
Web visits (see Figure 16) continue to decline (-5.8 percent in FY2016). This may be attributed to several factors that complicate the process of tracking virtual visits. This includes factors such as: almost 70 percent of continuously respond- ing libraries report having library apps for mobile devices and over 95 percent use social networking (see Figure 17). Since native apps are distinct from the website, it is likely these users are using an app rather than visiting the library website for the service/materials they need. Similarly, social network pages can be accessed without first visiting or possibly ever visiting the library website, so these web visits may not be counted—or worse—may be double or triple counted as they navigate across and between distinct web properties (e.g., ILS, Facebook, YouTube, Pinterest, Linked-In, Twitter, online databases, third party e-media services, etc.).
 The percentage of libraries that indicate they have community links (83.2 percent) and library staff content (80.7 percent) decreased again in FY2016, but 5.0% over 80 percent of continuously responding libraries still provide such content (see Figure 17). Fewer libraries reported that they support patron books reviews (37.5 percent) and online book clubs/discussion forums (26.3 percent). More libraries affirmed that they offer social networking (96.4 percent), virtual reference services (81.8 percent), content in languages other than English (47.6 percent), and user driven content (32.4 percent). Better integration of library content (website, ILS, …) with major search engines, providing/ promoting a mix of curated content on the website and other efforts should help drive traffic and possibly slow and/or reverse the downward trend in website visits.
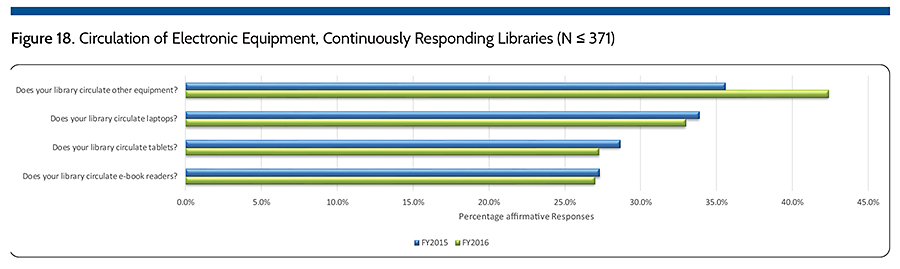
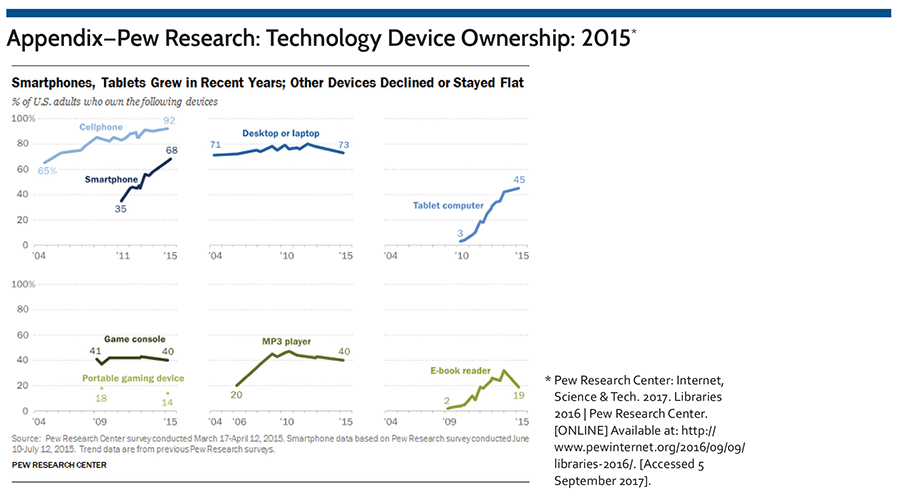
The percentage of libraries that circulate laptops (33.0 percent), tablets (27.2 percent) and e-readers (27.0 percent) decreased in FY2016 (see Figure 18). This appears to coincide with the growth in ownership of web enabled devices (smartphones, laptops and tablets) reported by Pew Research in mid-2015 (see appendix).4 More libraries affirmed that they circulate other equipment (42.4 percent), an increase of 6.8 percent from FY2015.
Population
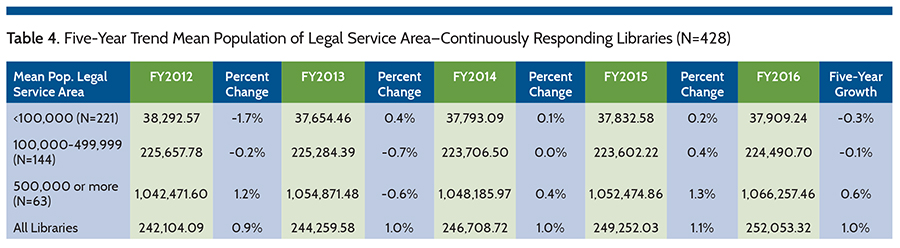
In the analysis of the data, many key ratios are based on the population of legal service area—i.e., trends on a per capita basis. Among the continuously reporting libraries (N=428), Table 4 shows that changes in populations served should be included in any analysis of the results. As such, our analysis of the data includes such comparisons using per capita results.
PLDS Survey Summary FY2016
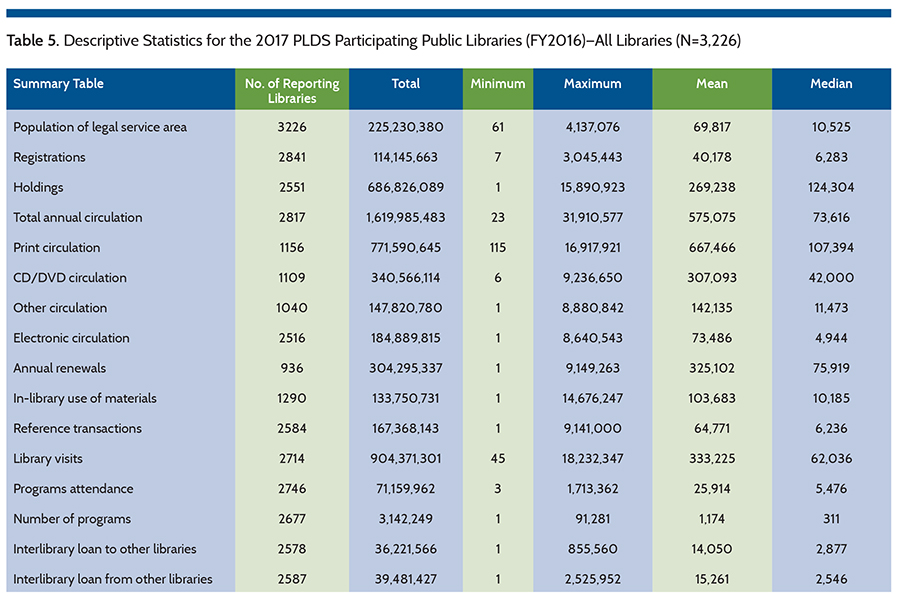
Table 5 (see page 30) summarizes usage data captured during the 2017 PLDS survey (FY2016 data). Overall more libraries reported all the measures listed in Table 5, however fewer libraries reported each component of circulation: print, CD/DVD, and other. As well, fewer libraries reported annual renewals in FY2016. Although fewer libraries reported these components of circulation, more libraries reported electronic circulation compared to FY2015.
References
- The World Bank Group. 2017. Data Bank | World Development Indicators, United States and Canada, (GDP, PPP (constant 2011 international $),[Accessed 4 September 2017]
- Pew Research Center: Internet, Science & Tech. 2017. Libraries 2016 | Pew Research Center. [Accessed 5 September 2017].
- Bureau of Labor Statistics. 2017. Employment status of the civilian non-institutional population, 1946 to date. 2017. [Accessed 30 October 2017].
- Pew Research Center: Internet, Science & Tech. 2017. Smartphones, Tablets Grew in Recent Years; Other Devices Declined or Stayed Flat | Pew Research Center. [ONLINE] Available at: . [Accessed 7 September 2017].
PLAmetrics
PLAmetrics.org is your portal to the Public Library Data Service (PLDS) Statistical Report digital database. The database offers you access to all the yearly PLDS data currently available (FY02–FY16) and access to the IMLS data (FY00–FY15). The report is compiled from surveys submitted by public libraries across the United States and Canada and presents timely and topical data on finances, library resources, annual use figures, and technology to assist public library administrators in making informed management decisions.
Tags: PLDS, plds statistical report