Learning From Our Statistics
Twelve Simple Rules for Understanding and Using Our Numbers Better
To utilize statistics effectively, librarians need to have an understanding of the underlying principles. An oft-neglected area of study in librarianship, statistical fundamentals are approached here in a simple rules format with examples. The purpose is to help librarians gather and use statistical information in new and better ways. This is of particular concern at this point in time when traditional library statistics like circulation and visitation are dropping nationwide due, in part, to the proliferation of convenient digital information sources.
Libraries are great at counting things. We count visits, user registrations, circulation, collection size, number of programs, attendance at programs, computer and Wi-Fi uses, website visits, and questions asked. We survey our communities to learn more about their needs and the impact of our services, and we tally their responses. And under pandemic conditions, we are counting all sorts of new things: reserves placed, curbside attendance, Zoom attendance, recorded program views, craft kits supplied, and newsletter opened.
Collectively, these numbers may contribute to persuasive infographics and annual reports demonstrating library usage to our communities, Boards, and funding agencies. This is important, since we are the recipients and stewards of public funds to be used for the greater good. However, as statistics in traditional areas like circulation and visitation drop nationwide (1) in the wake of the proliferation of convenient digital formats and pandemic-enforced closures, this is a good time to look more closely at statistics to see what we can learn.
Statistics demonstrate how our communities are using our resources to help us make good decisions about what to do next. These numbers are an important part of our library’s story, telling us what’s being used, what’s changing, what’s working, and what could maybe work better. When we make changes, the numbers before and after can tell us if we are moving in the right direction.
But statistics are often misused. They are sometimes treated as a scorecard where higher means better, encouraging library staff to focus on increasing numbers instead of on meeting needs. We misread data and draw incorrect conclusions. We make bad comparisons, look for trends with insufficient data, and miss connections. We count what is easy to count, and we don’t necessarily count what is important to know. Some of the most important information is simply not countable, and it may get ignored. We take surveys and allow the opinion of a few to stand for the majority (2).
For people who don’t love math, or who were never drawn to study it, using statistics to evaluate library services can be a bit perplexing. To be used effectively, we need to understand their limitations and best uses. Twelve simple rules can help us think about statistics more holistically and strategically.
1. Understand What You Are Measuring When You Count
Counting only measures one thing, so we really need to understand what we are measuring when we count. Our door counter tells us how many people passed in front of the device during a particular time span, and that is all. It does not tell us why they came, how long they stayed, how often they visit, or whether they found what they were looking for during their visit. It includes people who came and went multiple times, staff members and working volunteers, visitors from outside our population base, and people just avoiding bad weather.
Our circulation statistics tell us how many items were checked out or renewed. The don’t tell us if books were useful or even read. They don’t tell us a renewal was due to continued use or the inconvenience of an earlier return. And with the advent of autorenewals, these numbers tell us even less as we preemptively renew items ourselves, lumping potential overdue items in with actual requested renewals.
Tip: The numbers we collect are points of information, which when combined with other information, can help us make informed decisions. On their own, they are not a measure of whether or not we are meeting our mission or creating an impact. On their own, they tell us very little. Collected over time, they can help us see trends and tell a story.
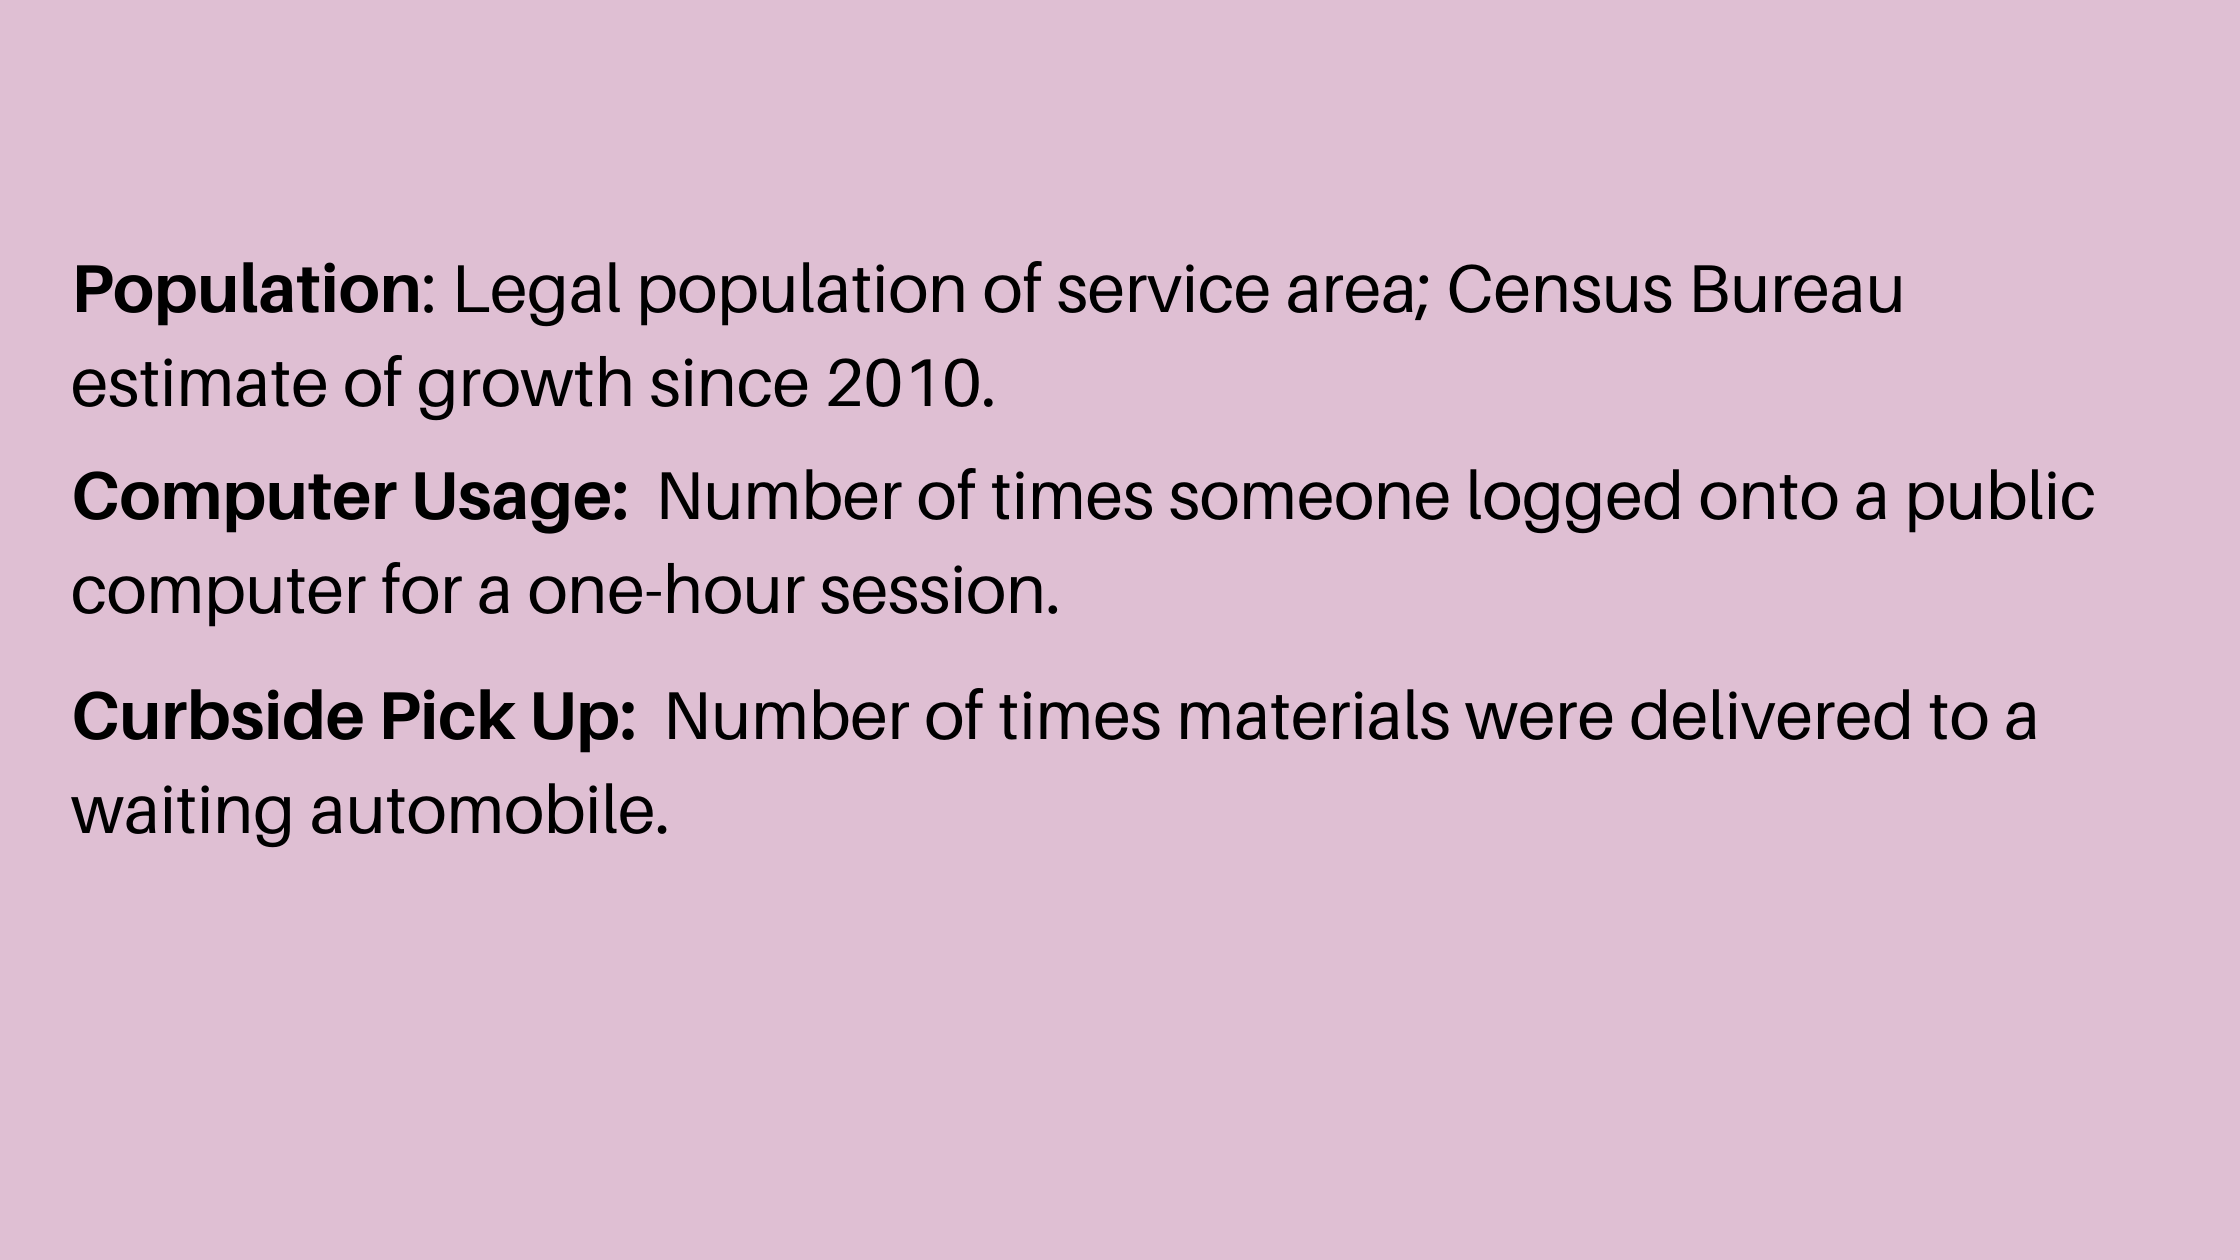
Tip: Whenever you create a statistical report, it is good practice to include a legend of exactly what was counted. Stating exactly what you are measuring will help you avoid drawing unwarranted conclusions. It may help you rethink how you are counting to see if there is a better way.
2. The More Accurate The Numbers You Collect, The Better Conclusions You Can Draw
Math is a precise science. When you apply math to estimated numbers, your accuracy decreases with each operation. This affects sums and differences, averages, percentages, services per capita, and turnover rates. The more you estimate, the less useful your statistics are for the purposes of evaluation.
Tip: When at all possible, count instead of estimate. If you need to estimate, employ counting as much as possible in the process. Count the attendees in a quarter of the room and multiply by four or count reference questions for one week each quarter and extrapolate to fifty-two weeks.
Tip: Be consistent with your counting. If you are running a report in your library software to get circulation data, make sure you are using the exact same parameters every time. If you are counting reference questions several weeks each year, try to do it the same weeks each year when activity levels will be similar.
Tip: If you think Census Bureau estimates since the last official count are incorrect for your population, check to see how student enrollment is changing in the local school district, which counts students every year, to get a better idea of how your population has changed.
3. Beware of Drawing Conclusions from Small or Overlapping Data Sets
If you have three people at your technology program one week and four the following week, you could claim an increase of 33%. From a statistical standpoint, though, this data set is too small to produce reliable data. The chance that the increase would be replicated or even maintained week after week is statistically small, so using this data to make decisions about what to do next would be ill-advised.
If you had 30 people at Monday’s storytime and 45 at Tuesday’s, you could claim that 75 people came to storytime, when in reality some people may have come to both. The decisions you make about storytime schedules may affect way fewer people than your totals would have you believe.
Tip: Increase the size of your data set by aggregating it across multiple instances. Compare one year of attendance with another instead of one month to the next. Compare all of your technology program attendance collectively instead of by individual program from month to month.
Tip: When you have overlapping data sets, it is especially important to use accurate language. You are counting how many people attended storytime on a given date, not how many different people came to your storytimes.
4. Averages Can Be Misleading
If your legal population size is 25,000 and your annual book circulation is 500,000, it would be tempting to say that on average, your community members read twenty books per year. You might picture this whole community of people, each with a stack of twenty books. And you would likely be picturing no actual person in your community. Why? Because circulation includes renewals, because checkouts do not necessarily mean books were read, and because many of your community members checked out one or zero books, while a few voracious readers borrowed ten items a week.
That same circulation data set might have a median of four (number of checkouts ranked lowest to highest has a middle value of four). This median is closer to the typical behavior of your community, but it still misses the point that every member of your community is unique.
Tip: You are planning services for a diverse community, so thinking about the average user may narrow your thinking about their needs. [3]
Tip: Using the median instead of the average can help reduce the effect of outliers. For example, the average program attendance may be skewed by your summer reading kickoff attendance of 1,000 people when other programs are in the 5 to 25 attendance range.
Tip: When tracking attendance numbers, the average number of people who come to a weekly program is less useful for space planning than knowing the minimum and maximum.
5. Statistics are Interrelated
Libraries serve their communities in multifaceted and increasingly complex ways, and state agencies each year add more fields to the data they want us to collect. Where we once counted computer uses, we now also collect Wi-Fi uses. Where we once counted programs, we now count children’s, teen, and adult programs separately.
What we notice as we measure more aspects of service is that a policy change or a change in the local environment may increase one statistic while making another statistic drop. For example, as your e-book collection use grows, people can check out from home, and your library visitation and physical collection circulation may drop. As readers’ advisory aids are integrated in your catalog, questions at the desk may decline. The more accessible your databases are through your website, the less demand there should be for reference help. The more intuitive your collection layout and signage is, the less people should need help finding things.
Tip: When you improve services, be prepared to find new ways to count, even ways that the state doesn’t recognize yet. Leaving an e-resources consortium to create a stand-alone collection may result in a smaller collection but it may also reduce wait times and eventually increase usage.
Tip: When a statistic trends upward or downward, look for changes in other statistics that may be systemically related.
6. Stop Chasing Statistics (More is Not Necessarily Better)
When circulation drops, we may be tempted to rearrange the collection, add display shelves, create additional signage, weed, buy newer materials, and increase the number of shelves since materials are crowded when fewer things are being checked out.
Any one of these strategies might make the collection more attractive and invite more usage, which would be a good thing. However, sometimes a decrease in statistics means there has been a reduction in community need for that service. If the demand for health books has dropped because information in databases and the internet is easier to navigate and more current, then trying to increase the circulation of the physical collection will be a waste of time and money and will not serve the community.
Tip: Whenever a statistical measure drops, think about your goals for the community first. Your community doesn’t care whether your collection circulations 100,000 times or 200,000 times. They care whether they can find the information they need in a format and timeframe convenient to them.
Tip: When circulation drops, your shelves get more crowded. The answer to these crowded shelves is not adding more shelves. The answer is weeding and curating better. You may also need to reduce shelving to create space for something the community needs more!
Tip: Digital circulation may never make up for losses in physical collection circulation. Many digital resources are easily accessible and reasonable inexpensive for patrons to access on their own, while the same resources are expensive or unavailable for libraries, subject to licensing expiration, and circulated sequentially with wait times. Where libraries could enthusiastically recommend that patrons check out physical materials, we are more cautious with digital resources that diminish in availability with each additional circulation. A digital collection operates differently than a physical collection and we will need to think about new ways to measure the effectiveness of these collections.
7. Don’t Look Too Often
We count and record every day, and we tally every month. But if we look that often for meaning, we give disproportionate attention to detail because there is so much of it. In statistics, we are said to be experiencing a high ratio of noise (data we should not be paying attention to) to signal (the important pieces of information we should be paying attention to). [4]
The greatest strength of statistics gathering is the view it gives us of trends over time. If you look at too short an interval of time, you may be comparing a library in the throes of a digital revolution with a library that relied on now-declining formats like CDs and DVDs for a large portion of its circulation.
Tip: In monthly reports to the Board, putting comparative data in a table may suggest that it is more important than it is. Numbers have the aura of indisputable facts, after all. Skip the comparison and report the month’s total in narrative form, simply telling of this month’s activity. Add table periodically to focus attention on particular shifts in usage that you want to explore with the Board.
Tip: Sometimes you need to take the longest possible view by comparing your trends to the trends of libraries in general and libraries of similar size and demography. If everyone’s circulation is dropping, it may not be anything you are doing or not doing that is causing the change.
8. Compare with Caution
It’s tempting when the state or national statistics are released each year to start comparing our libraries to others. In almost every case, we will be comparing apples to oranges. While public libraries may have similar missions, the communities we serve are unique. We have difference in building sizes, revenue levels, governance, population density, area served, diversity, education levels, local economies, public transportation, etc., all of which may affect our statistics.
We also collect our statistics differently than each other. A library’s legal service population may be very different than the actual population being served. Libraries count circulation and computer uses using different parameters within the limits of their library software and policies. What is recorded as a reference question varies from library to library and even employee to employee.
Tip: If you peruse the IMLS or your state’s annual library data, filter the data for libraries with a population within about 10% of your and expenditure within about 10% of yours, aiming for a benchmark set of at least ten libraries and at most about 200. Then compare their usage trends over time with yours. If a library stands out as similar to your or particularly high-performing, you might inspect their website to see if there is anything you can learn that might be useful.
9. Beware of Unwarranted Conclusions
If thirty people come to storytime on Mondays and half that come on Tuesdays, you might think that your Tuesday storytime leader needs improvement. In actuality, it may be that your parking lot is too full on Tuesdays, your Tuesday storytime is too close to lunch, or the church down the street has a competing program on Tuesdays. It could be that the kids that typically come on Tuesday are aging out of storytime, and it may be that the smaller size group is just perfect for this group of children.
Tip: When a statistic seems to point to an issue, look for all possible causes. Consider that there may be multiple causes, random interference, or no cause at all. Consider that it might not even be a problem.
Tip: When looking at differences in statistics, consider data from other sources that might lend an explanation or offer insight.
10. Survey for Stories
The surveys we do are almost always statistically insufficient. For a survey to be statistically useful, you need well-designed questions asked of a random sampling of people in a number significant to the whole of the population. There are online calculators to help you determine your sample size, for a population of 25,000 you would need about 1,000 respondents to be 95% assured of a 3% margin of error.[5] That may sound like gobbledygook, but the point here is that you need a large sampling of respondents to reach any sort of reliable conclusions, statistically speaking.
The surveys libraries typically do provide anecdotal information which may still be helpful. If you send out a survey and get 160 responses from your population of 25,000 people, you don’t have the numbers for statistical accuracy. If fifty of those people tell you that your late fees are too high, this may be worth paying attention to. If one person tells you that the electrical outlet in your study area is causing a shock, that is really good to know, despite the lack of statistical relevance.
Tip: Use surveys to gather anecdotal information. Look for common themes in the stories you are hearing. Don’t over-value tallied results.
Tip: Use surveys to share information as well. When you provide a list of services asking people to check which ones they use, you are simultaneously informing them of those services.
11. Periodically Take a Deep Dive on Some of Your Statistics
Go below the surface by counting more than the state asks you to in order to learn other things. When you are counting reference questions, create a table to tally research, technology, readers’ advisory, and other questions separately. Total your questions answered by hour and day of the week. Learning what percentage of your questions come from different categories and knowing when you get the most questions may help you with staffing and training decisions.
You can track first circulation separately from renewals. You can track circulation by area of collection or new items separately from existing items. On reference count week, you might also ask staff to track hours spent on other task to help determine the cost of an ILL, fees to charge for processing on lost materials, or the amount of time to allot for program preparation.
Tip: As part of your strategic planning process, look at the trends over three to five years in every count available to you to paint as complete a picture of operations as you can. A membership review, for example might include the percentage of your community that has library cards, the percentage of your users that live within your service area, the percentage of your accounts that have checked out a physical item in the year, the number of new and expiring each year, and of course, the trends in those areas.
Tip: Whenever you are making a change, take measurements before and then measure again at six months and a year to see what affect the change had.
12. If You are Making Operational Decisions, Ask Yourself How Numbers Might Help
Trying to decide whether to add autorenewal? A table that compares first circulation, renewals, and reserves over time will help you calculate how many autorenewals (renewals of un-reserved items that weren’t already being renewed) your library is likely to process as a percentage of your circulation. It’s an imperfect number, but at our library, we would expect about a 20-25% increase in overall circulation count, allowing for one autorenewal for each item. This is one piece of information to help us make this decision.
Tip: Try calculating cost per circulation for different parts of your collection. Divide annual expense by annual circulation/use for your physical collection, e-books, e-magazines, streamed videos, and each database. This may help you with collection expenditure allocation decisions, keeping in mind that physical collections require much greater staff time than digital collections.
Tip: When preparing for a renovation, try head count studies. Divide your current facility into functional regions and have staff count the users in each area every half hour for a week, then repeat a couple more times at different seasons. Look for patterns in how your spaces are being used at different times of the day and days of the week to help you decide what kinds of space you need.
Tip: Learn Excel and practice. Your library probably offers an online resource to help you learn it if you haven’t already. A few easy formulas can be so helpful for comparing data and spotting anomalies.
Conclusion
Libraries that underutilize statistics are missing out on a valuable tool for informed decision-making. Understanding the logic behind statistics gathering can lead to the intentional collection of specific data to aid in the evaluation of services and resources. This is critical as we focus on building digital collections, developing our space for multiple uses, developing programs to provide for changing community information needs, and providing essential services during an epidemic.
Just as critical though, is to realize that our statistics measure usage rather than performance. Twentieth century management theory, born on the factory floor, taught us to count task completed per time period and to set related goals to improve efficiency, but libraries are not factories and efficiency is rarely our goal. Our focus should be on services, meeting community needs, and building relationships delivered in a sustainable way, and the statistics we gather should help us better understand how we are meeting those goals.
References and Further Reading
- “Public Libraries Survey (PLS) Data and Reports,” Institute of Museum and Library Services, November 19, 2018, www.imls.gov/research-evaluation/data-collection/public-libraries-survey/explore-pls-data/pla-data. Between 2010 and 2018, nationwide circulation dropped 11.7% from 2.47B to 2.18B and visitation dropped by 17.9% from 1.57B to 1.29B. Population served grew during the same period from 308M to 325M for an increase of 5.5%.
- Jerry Z. Muller, “The Tyranny of Metrics” (Princeton, NJ: Princeton University Press, 2018).
- Todd Rose, “The End of Average: How We Succeed in a World that Values Sameness” (New York: Harper Collins, 2016).
- Nassim Nicholas Taleb, “Antifragile: Things That Gain from Disorder” (New York: Random House, 2016), 125-27.
- “Sample Size Calculator: Understanding Sample Size,” SurveyMonkey, www.surveysystem.com/sscalc.htm.
Tags: library statistics